
Part I: A Review of Why Graph PoCs Struggle to Demonstrate Success or Progress to Production
This is Part 1 of a two-part series on graph database PoC success and production deployment.
Introduction
I began my journey with graphs around 2014 when I discovered network theory and tools like NetworkX and Neo4j. As our world becomes increasingly connected, it makes sense to work with data by leveraging its inherent connections. Soon, every problem I faced seemed ideally suited for graph solutions.
Early in my experiences, I worked with a biotech startup, exploring how graphs could surface insights into drug-protein interactions (DPI). The team was excited about graphs’ potential to reveal latent signals that traditional analytics missed. With a small budget, we created a Proof-of-Concept (PoC) to demonstrate the “art of the possible.” After a quick kick-off meeting, we loaded data into a free graph database and wrote queries exploring the DPI network. In just three months, we established novel insights that advanced the team’s understanding.
Despite what we considered success, the engagement wasn’t extended. More troubling, I later learned our PoC had been put into a production-like environment where it failed to scale in performance or handle new data sources. What went wrong? How had we lost the potential scientific value of what we’d built?
This experience highlights a common problem in the graph domain: many promising PoCs never make it to production. Through reflection, I’ve developed strategies for avoiding these issues and increasing the likelihood of successful transitions to production. This blog explores why graph PoCs fail and presents a holistic approach for success. It complements the blog Why Graph Implementations Fail (Early Signs & Successes).
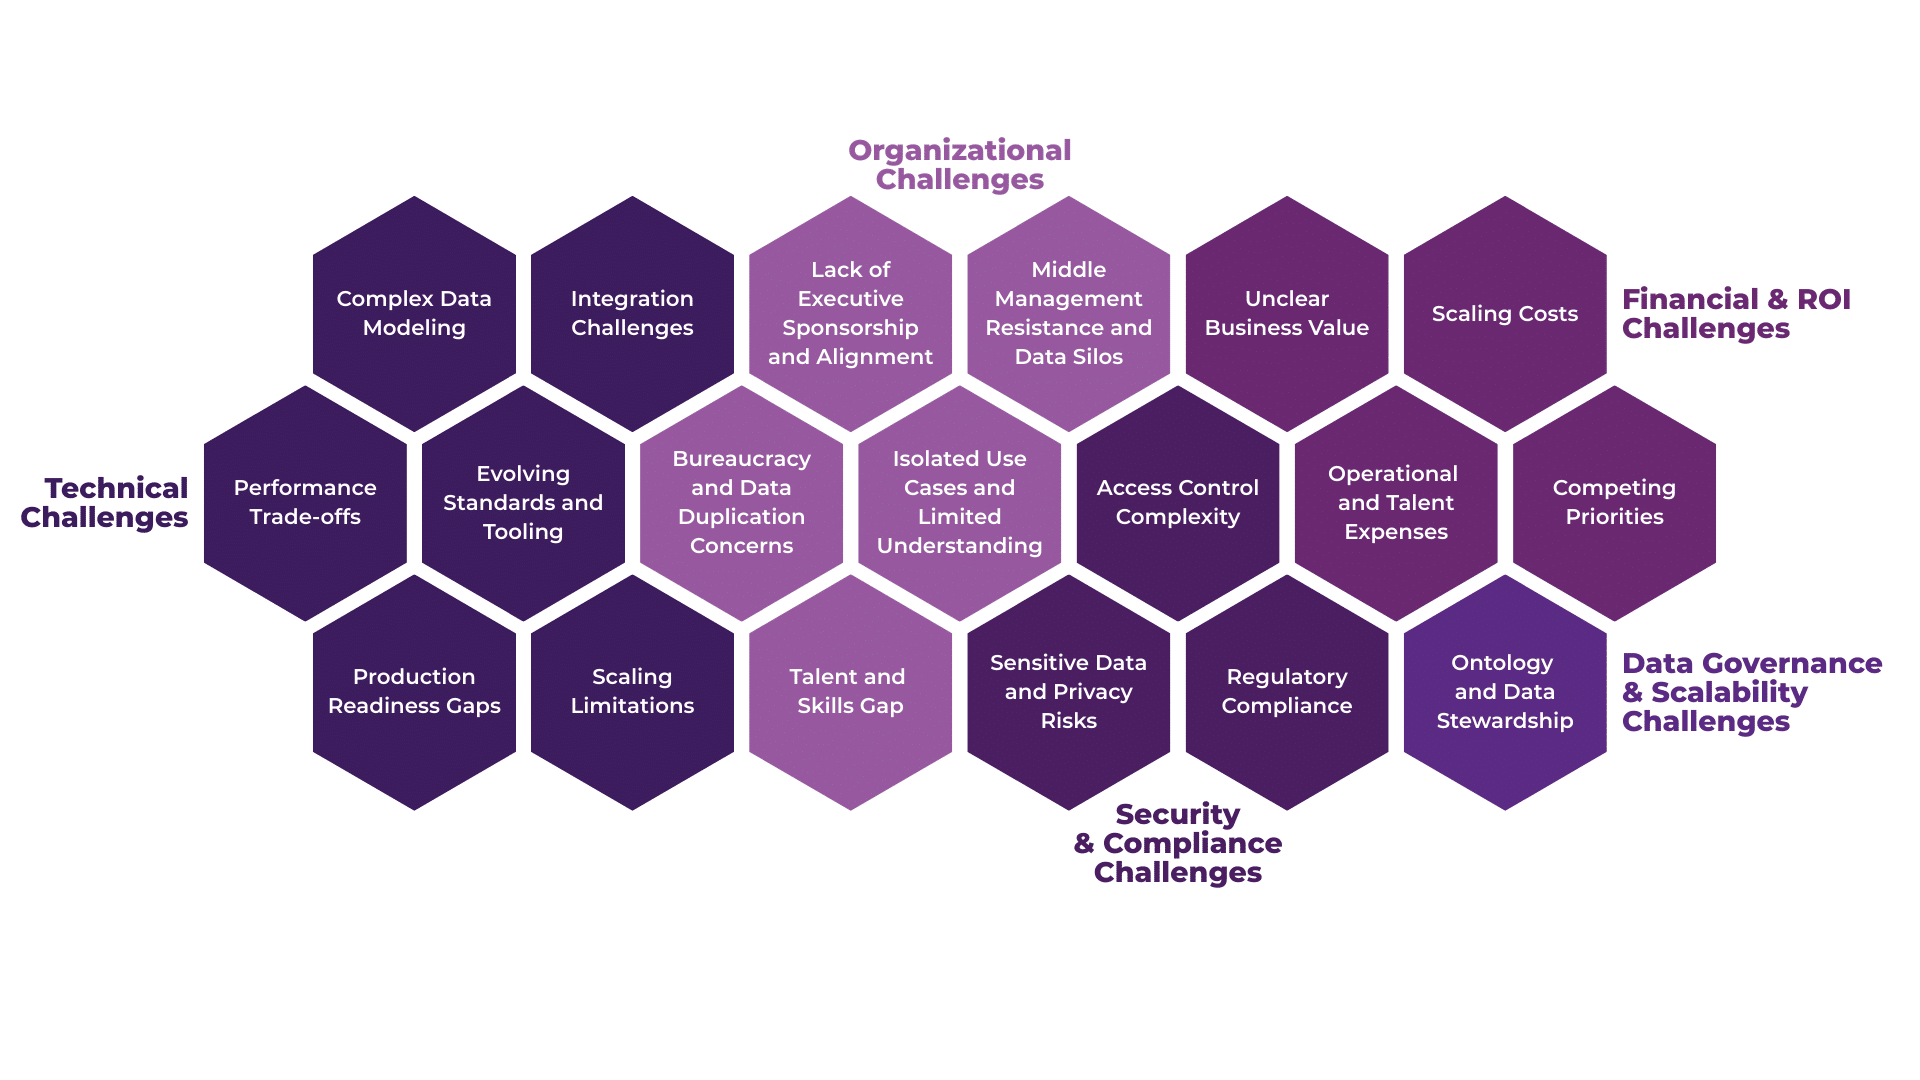
Why Graph Database Solutions and Knowledge Graph PoCs Often Fail
Organizational Challenges
Lack of Executive Sponsorship and Alignment
Successful production deployments require strong top-level support. Without executive buy-in, graph initiatives seldom become priorities or receive funding. Executives often don’t understand the limitations of existing approaches or the paradigm shift that graphs represent.
The lack of sponsorship is compounded by how graph practitioners approach stakeholders. We often begin with technical explanations of graph theory, ontologies, and the differences between Resource Description Framework (RDF) and Label Property Graphs (LPG), rather than focusing on business value. No wonder executives struggle to understand why graph initiatives deserve funding over other projects. I’ve been guilty of this myself, starting conversations with “Let me tell you about Leonhard Euler and graph theory…” instead of addressing business problems directly.
Middle Management Resistance and Data Silos
Even with executive interest, mid-level managers can inhibit progress. Many have vested interests in existing systems and fear losing control over their data domains. They’re comfortable with familiar relational databases and may view knowledge graphs as threats to their “systems of record”. This presents an opportunity to engage managers and demonstrate how graphs can integrate with existing systems and support their goals.For example, a graph database may load data “just in time” to perform a connected data analysis and then drop the data after returning the analytic results. This would be an ephemeral use of graph analytics.
Bureaucracy and Data Duplication Concerns
Large organizations have lengthy approval processes for new technologies. Infrastructure teams may be reluctant to support experimental technology without an established return on investment (ROI).
A critical but often undiscussed factor is that graph databases typically require extracting data from existing sources and creating another copy—raising security risks, infrastructure costs, and data synchronization concerns. This is the Achilles heel of graph databases. However, emerging trends in decoupling data from query engines may offer alternatives to this problem. A new paradigm is emerging where data in data lakes can be analyzed through a graph lens at rest without an ETL ingestion into a graph database. Graph query engines enable data to be viewed through traditional relational and now connected data lenses.
Isolated Use Cases and Limited Understanding
Many graph initiatives start as isolated projects tackling narrow use cases. While this limits upfront risk, it can make the impact seem trivial. Conventional technologies might solve that single problem adequately, leading skeptics to question whether a new approach is needed. The real value of knowledge graphs emerges when connecting data across silos—something that’s hard to demonstrate in limited-scope PoCs.
A practical approach I’ve found effective is asking stakeholders to diagram their problem at a whiteboard. This naturally reveals how they’re already thinking in graph terms, making it easier to demonstrate the value of a graph approach.
Talent and Skills Gap
Graph technologies require specialized skills that are in short supply. Learning curve issues affect even experienced developers, who must master new query languages and paradigms. This shortage of expertise can lead to reliance on a few key individuals, putting projects at risk if they leave.
Technical Challenges
Complex Data Modeling
Graph data models require a different mindset than relational schemas. Designing an effective graph schema or ontology is complex, and mistakes can lead to poor performance. Equally, an effective semantic layer is critical to understanding the meaning of an organization’s data. The schema-less flexibility of graphs can be a double-edged sword—without careful planning, a PoC might be built ad-hoc and prove inefficient or lead to data quality issues when scaled up. Refactoring a graph model late in development can be a major undertaking that casts doubt on the technology itself.
Integration Challenges
Enterprise data rarely lives in one place. Integrating graphs and other solutions with legacy systems requires extensive data mapping and transformation. Without smooth interoperability via connectors, APIs, or virtualization layers, the graph becomes an isolated silo with limited production value. Decoupled approaches mentioned above address this solution by focusing on graph and connected data analytics as a standalone feature of graph query engines. Tooling optimized for graphs are making ETL and integration of graph databases easier and more efficient.
Performance Trade-offs
Graph databases excel at traversing complex relationships but may underperform for simple transactions compared to optimized relational databases. In a PoC with a small dataset, this may not be immediately noticeable, but production workloads expose these limitations. As data volumes grow, even traversals that were fast in the PoC can slow significantly, requiring careful performance tuning and possibly hybrid approaches.
Evolving Standards and Tooling
The graph ecosystem is still evolving, with multiple database models and query languages (Cypher, Gremlin, SPARQL). More recently, decoupled graph query engines enable analyzing tabular and columnar data as if it were a graph, supporting the concept of “Single Copy Analytics” and concurrently increasing the breadth of options for graph analytics. Unlike the relational world with SQL and decades of tooling, graph technologies lack standardization, making it difficult to find mature tools for monitoring, validation, and analytics integration. This inconsistency means organizations must develop more in-house expertise and custom tools.
Production Readiness Gaps
Production deployment requires high availability, backups, and disaster recovery—considerations often overlooked during PoCs. Some graph databases lack battle-tested replication, clustering, and monitoring solutions. Integrating with enterprise logging and DevOps pipelines requires additional effort that can derail production transitions. In the next blog on this topic, we will present strategies for integrating logging into a PoC and production releases.
Scaling Limitations
Graph databases often struggle with horizontal scaling compared to relational databases. While this isn’t apparent in small PoCs, production deployment across multiple servers can reveal significant challenges. As graphs grow larger and more complex, query performance can degrade dramatically without careful tuning and indexing strategies. We will explore how to thoughtfully scale graph efforts in the next blog on taking projects from PoC to Production.
Security and Compliance Challenges
Access Control Complexity
Graphs connect data in ways that complicate fine-grained access control. In a relational system, you might restrict access to certain tables; in a graph, queries traverse multiple node types and relationships. Implementing security after the fact is tremendously complex. Demonstrating that a graph solution can respect existing entitlements and implement role-based access control is crucial.
Sensitive Data and Privacy Risks
Graphs can amplify privacy concerns because of their connected nature. An unauthorized user gaining partial access might infer much more from relationship patterns. This interconnectedness raises security stakes—you must protect not just individual data points but relationships as well.
Regulatory Compliance
Regulations like GDPR, HIPAA, or PCI present unique challenges for graphs. For instance, GDPR’s “right to be forgotten” is difficult to implement when deleting a node might leave residual links or inferred knowledge. Auditing requires tracking which relationships were traversed, and demonstrating data lineage becomes complex. If compliance wasn’t planned for in the PoC, retrofitting it can stall production deployment.
Financial and ROI Challenges
Unclear Business Value
Justifying a graph project financially is tricky, especially when benefits are long-term or indirect. A PoC might show an interesting capability, but translating that into clear ROI is difficult if only one use case is demonstrated. Without a strong business case tied to measurable Key Performance Indicators (KPIs), projects struggle to secure production funding.
Scaling Costs
PoCs often leverage free or low-cost resources. However, production deployment requires enterprise licenses, robust infrastructure, and high-availability configurations. An enterprise-level knowledge graph spanning multiple use cases can incur significant long-term costs. These financial requirements can shock organizations that didn’t plan for them.
Operational and Talent Expenses
Beyond technology costs, successfully operating a knowledge graph requires specialized talent—data engineers, knowledge engineers, and graph database administrators. While a PoC might be built by a single person or small team, maintaining a production graph could require several dedicated staff. This represents a significant ongoing expense that organizations often underestimate.
Competing Priorities
Every project competes for finite resources. Graph initiatives promise strategic long-term benefits but may seem less immediately impactful than customer-facing applications. Organizations focused on quarterly results may abandon graph projects if they don’t show quick wins. Breaking the roadmap into phased deliverables demonstrating incremental value can help maintain support.
Data Governance and Scalability Challenges
Ontology and Data Stewardship
Knowledge graphs require consistent definitions across the enterprise. Many organizations lack ontology expertise, leading to inconsistent data modeling. Strong governance is essential to manage how data elements are defined, connected, and updated. Without data stewards responsible for accuracy, production graphs can become unreliable or inconsistent, undermining user trust.
Conclusion
Transitioning a graph database or knowledge graph from PoC to production involves multiple challenges across organizational, technical, security, financial, governance, and talent dimensions. Many promising PoCs fail to cross this “last mile” due to one or more of these issues.
In Part Two, I’ll outline a holistic strategy for successful graph initiatives that can effectively transition to production—incorporating executive alignment, technical best practices, emerging trends like GraphRAG and semantic layers, and the critical people-process factors that make the difference between a stalled pilot and a thriving production deployment.