
Utilizing semantic applications in your business, such as an enterprise taxonomy, ontology, or knowledge graph, can increase efficiency, reduce cognitive load, and improve cohesion across the enterprise, among other benefits. While these benefits are extremely valuable they can be difficult to quantify and measure. Utilizing Key Performance Indicators (KPIs) is a common tactic that can directly tie the semantic integration into the business value it creates. This can be utilized to increase buy-in from leadership, build a common understanding of goals and trajectory, keep projects on track, and to tell powerful stories about the benefits created through these critical investments.
Why KPIs?
KPIs are evaluation metrics that are specific, measurable, and goal-oriented. Good KPIs are easy to communicate and translate directly into business value. They are used to support trends over time and can be combined with other measures to tell a story. They are focused on the activity at hand, and thus the specific metrics are tied to the use-case, business drivers, and the overall goals of any given initiative.
The broad objectives frequently associated with semantic tools, such as increased efficiency or more cohesive understanding across the organization can be particularly difficult to quantify and track. KPIs serve as a bridge, creating qualitative metrics to measure against and serving as course correctors to keep projects focused and on track. Without KPIs, lofty objectives can hang like rain clouds, hovering with ambiguity over otherwise productive efforts. At EK we have seen the impact of murky objectives or a lack of KPIs manifest through time errantly devoted to the wrong efforts, misunderstandings of the intended outcomes, or even an impediment to generating buy-in from leadership. KPIs quantify ROI and provide clear metrics to measure impact before, during, and after a semantic integration. These ways to see progress throughout a project lifecycle serve to unify and create momentum for businesses.
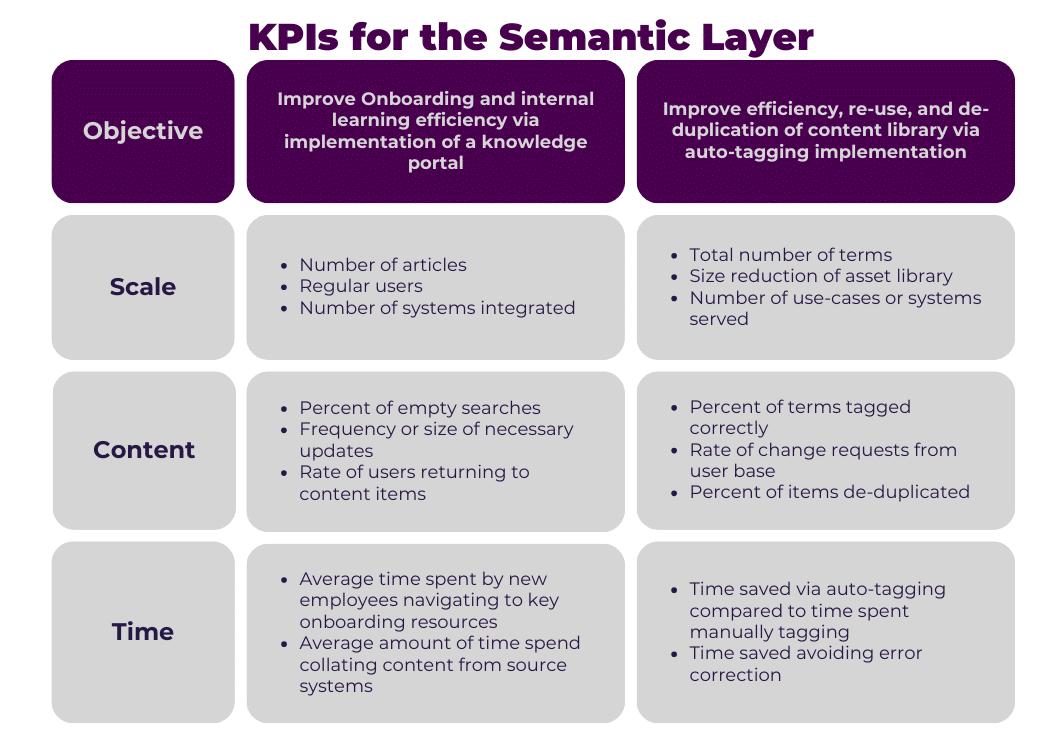
Creating KPIs that assess the impact of a semantic integration is both a challenge and a skill. Since KPIs are inherently tied to business objectives and specific use-cases it is hard to provide a standard set of KPIs for the semantic layer. The matrix below provides some example objectives and potential KPIs in 3 key areas: Scale, Content, and Time. More details on each focus area is elaborated on following the graphic.
Scale
Measurements of scale can be used to understand the sheer size of the semantic layer and to compare multiple iterations to demonstrate growth, such as the number of entities in a knowledge graph, or terms in a taxonomy. Conversely, the reduction in size of the content or asset library can also be an important measure, for instance when performing deduplication. Reducing the scale of asset libraries can also have a marked impact on additional business motivations such as a reduction in the cost and/or carbon footprint required to support oversized data servers. Additionally, a smaller content library results in a lower cognitive load for end users and less redundant, or incorrect information. In one project, an investment and insurance company was struggling with inefficient search and users were frustrated because the content that was returned to them was frequently out of date or inaccessible. Content auditing, a standardized taxonomy, and auto-tagging workflows were employed and EK identified that about 45% of the content in their existing library was obsolete or outdated. By cleaning up this content prior to migrating to a new system the scale of the library was reduced. This reduction in size paired with a newly standardized enterprise taxonomy resulted in more accurate content descriptions and a more relevant library for users. This occurrence is far from uncommon and emphasizes the critical nature of content cleanup and maintaining a “right-size” content library.
Content Management and Fit
Common measures of accuracy for taxonomies include an understanding of precision (is the returned information correct?) as well as recall (is all the expected information included?). Assessing content fit is notoriously difficult, generally reliant on Subject Matter Experts and qualitative data, and thus is very tricky to quantify. Focused KPIs can help to quantify this data, for example, if the percentage of correctly auto tagged terms is 75% at the first evaluation mark and 90% at the next point of measure, then the system is 15% more accurate. Measuring accuracy is a critical step in the iterative development of taxonomy and other semantic solutions. Without an understanding of what is working, it is impossible to understand what changes need to be made. Being able to find and access accurate and up-to-date information is a common pain point that we see among businesses who come to EK. After reducing the size of the content library through content clean up, the business in our earlier example was able to apply a newly formed enterprise taxonomy to their content with an auto-tagging workflow. Analysis of this effort found that the one time auto-tagging process had a 86-99% success rate depending on the content type. This effort greatly increased the accuracy of the metadata describing the content resulting in a better semantic search experience and increased findability across the enterprise.
Time
One of the major changes that a well tuned semantic layer can bring about is a measurable amount of time saved. From auto-tagging and other automations to reducing duplication and incorrect information. Time savings increase user satisfaction as well as create a tangible benefit for the company in reduction of “human-hours” spent on any given task. This reduction in hours is an easily measurable reference point, since it can generally translate directly into the labor cost of any given employee. If a semantic solution reduces errors in the data, then measuring the number of errors corrected within the new system can be used to understand the time-savings now that errors do not need to be manually corrected. Similarly, the number of documents auto-tagged can be used to tell a story of time not spent manually tagging content. In the example cited in the two previous sections, after cleaning up content and applying the new taxonomy through auto-tagging EK estimated that the necessary human effort related to the content migration was reduced by nearly 80%. This is truly a remarkable improvement that had both immediate and long term benefits.
Conclusion
Throughout our engagements EK has learned critical lessons about the importance of creating and using KPIs. Anecdotal evidence can be a powerful tool, but even more powerful are anecdotes backed by quantified measures. Learning how to set and track KPIs at the outset of a project provides the opportunity to understand and quantify the impact of semantic integrations. Across a variety of projects, KPIs have been core data points that help keep projects focused, and keep efforts directed towards the most important areas of a project. When faced with murky or unclear objectives and a lack of KPIs our teams have seen projects sit with the wheels spinning, have needed to re-do work, and have seen focus shift onto unnecessary components of a project, to the detriment of other components. On the flip side, well crafted KPIs have been utilized to prove business value, spot inefficiencies, and improve semantic solutions over and over again. KPIs can be utilized over time to tell a story that will help you and your business better understand and track goals met through the use of your taxonomy, ontology, or knowledge graph. The team at EK is well versed in developing both the semantic solutions you need as well as the KPIs necessary to evaluate, understand, and promote these solutions. To learn more about how we can help, contact EK today.