

The Challenge
A global management consulting firm needed to establish a standardized, central platform for consultants to see insights on environmental impacts associated with supply chain processes. Historically, this information was stored in disparate locations, often hidden within departmental documents or client deliverables. Additionally, there was no standardized vocabulary used across these different data sources, leading to inconsistent understandings of key business concepts. These challenges caused consultants to lose valuable time searching for data and experts that could provide relevant insights on a new project. Thus, the firm recognized a need to create a centralized location to find data on past projects that would help consultants support future recommendations to their clients. This challenge required rigorous knowledge modeling that would be scalable and provide a reliable access point for information retrieval at the time of need.

The Solution
EK employed our Knowledge Graph Accelerator model to rapidly create a semantic data layer and web application that connected consultants to both the relevant data and people in a quick and efficient manner. To build the semantic data layer, EK created an ontology and starter taxonomy to establish relationships between core concepts and standardize the knowledge model. From there, the team implemented a knowledge graph datastore using data catalog and transformation tooling in partnership with data.world. EK established parameterized queries to enable self-serve analysis for consultants within data.world and also built a web app with faceted navigation on the taxonomy on top of these queries, surfacing relevant insights for business users to quickly make decisions.
EK then provided a clear roadmap and guidelines for the firm to implement and scale knowledge graphs across multiple practices and data sources. As part of defining this roadmap EK included the following recommendations:
- Guidance on how to make changes or adjustments to the application’s taxonomies
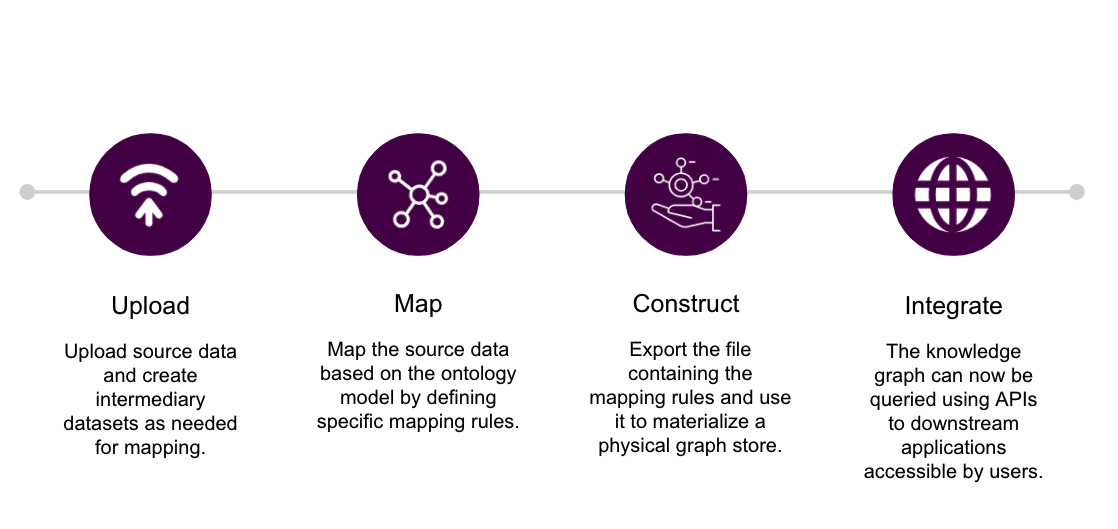
- Technology recommendations for taxonomy and ontology management, cloud-based graph storage, data cataloging, and ETL workflows (See Figure 1)
- Roles, responsibilities, and an organizational structure to make graph application adoption successful

The EK Difference
EK’s extensive experience in designing and implementing knowledge graph solutions enabled the team to demonstrate tangible, clickable results in less than two months. Together with the consulting firm, the team implemented a starter taxonomy, ontology, and frontend application, all of which were architected in a way that allowed for an easily scaled solution and rapid future growth of this product. EK partnered with the firm’s sustainability consulting group to ensure a transparent and collaborative process and utilized an agile development method to develop and gather feedback concurrently. After initial development, EK provided support in migration of this software into different environments as well as continued recommendations on strategy and how to achieve rapid adoption across the firm’s larger practices.

The Results
EK enabled the firm to advise on efficient measures to limit environmental impact and optimize cost. The firm can now leverage their extensive knowledge base around methods to reduce environmental impact and scale a centralized database of previously-tacit knowledge surrounding sustainability solutions. In the end, the firm left with the following outcomes:
- Greater Connectivity: Embedded, machine-readable relationships between all concepts that have hierarchy and do not require tables and complex joins.
- Scalability: Data model designed for organic growth that does not require extensive rework when adding new relationships and a variety of analytics and data from multiple sources.
- Performance: A performant data store that delivers query results quickly and enables integration with multiple downstream applications.
- Interoperability: A data model that is based on web standards, minimizing vendor lock, ensuring ease of management, long term scale, and interoperability across the firm’s systems and platforms.
- Quality and Reputability: Consultants can leverage insights that are certified and align with industry standards to provide clients with a strategy that can generate profit while supporting sustainability mission and impact.
- Industry Intelligence: The firm will be able to connect knowledge and data related to environmental sustainability to detect patterns and provide market intelligence to their clients.
Through this use case, the firm was also able to see the value of graph data in action, arming them with a demo-able product that could test the compatibility of graph modeling for their solutions. This drove the firm to expand knowledge graph products to new areas of the organization to support standardization and connectivity.