
Graph solutions have gained momentum due to their wide-ranging applications across multiple industries. Gartner predicts that graph technologies will be used in 80% of data and analytics innovations by 2025, up from 10% in 2021. Several factors are driving the adoption of knowledge graphs. Specifically, the increasing amount of data being generated and collected, and the need to make sense of it, and its use in artificial intelligence and machine learning, which can benefit from the structured data and context provided by knowledge graphs.
For many organizations, however, the question remains, “Is it the right solution for us?” We get this question regularly. Here, I will draw upon our own experience from client projects and lessons learned to provide a selection of optimal use cases for knowledge graphs and semantic solutions along with real world examples of their applications.
Use Case #1: Customer 360 / Enterprise 360
Customer data is typically spread across multiple applications, departments, and regions. Each team and system need to keep diverse sets of data about their customers in order to play their specific role – inadvertently leading to siloed experiences. A graph solution allows us to create a connection layer that facilitates consistent aggregation and ingestion of diverse information types from sources, internal or external, to the organization. Graphs boost knowledge discovery and efficient data-driven analytics to understand a company’s relationship with customers and personalize marketing, products, and services.
Real World Examples:
Customer 360 for a Commercial Real-Estate Company
“We lost a multi-million-dollar value customer after one of our regional sales reps offered the customer a property that the customer already owned. How do we get better with understanding our customers? We would like to be able to quickly answer questions like:
- Who is our repeat customer in North America over the last 10 years?”
Customer 360 for a Global Digital Marketing and Technology Firm
“Our customer databases contain records for more than 2 billion distinct consumers (supposed to be reflecting an estimated 240 million real world individuals) – we need to understand how many versions of ‘Customer A’ we have in order to integrate the intelligence gathered from different data sources to fully understand each customer.”
Solution Outcomes: Lead generation and sales cycles are improved through faster access to content and improved customer intelligence (and ability to customize materials), where a 1% decrease in time spent searching for customer information by a sales rep resulted in $6.24M in cost savings annually. Increased awareness of and ability to leverage customer connections within these companies, helps foster positive customer relationships.
Use Case #2: Content Personalization
 The next critical step after understanding customers is to personalize and recommend relevant content to them. With the size of data and dropping attention spans of online users, digital personalization has become one of the top priorities for companies’ business models. Especially with third-party cookies being phased out, companies need innovative ways to understand and target their online customers with relevant and personalized content. Graph analytics provide a meaningful way to aggregate information about a customer and create relationships with your solutions and services to determine a way to decide what information is right to share with a customer.
Real World Examples:
Customer Journey Map for a Healthcare Training and Information Provider
“We want to understand a patient’s journey to serve the next best content and information using the right channel and cadence.”
“We want to deliver tailored training content and course recommendations based on our audience and their setting so that we can connect users with the exact learning content that would help them better master key competencies.”
Solution Outcomes: A semantic recommendation service that is beating accuracy benchmarks and replacing manual processes aggregating content – that is supporting higher-quality, more advanced, and targeted recommendations with clear reasons. Rich metadata and semantic modeling continue to drive the matching of 50K training materials to specific curricula, leading new, data-driven, audience-based marketing efforts that demonstrate how the recommender service is achieving increased engagement and performance from over 2.3 million users.
Use Case #3: Supply Chain and Environmental Social Governance (ESG)
 Having a plan for ESG is no longer an option. Many organizations now have a goal to establish a standardized, central platform to get insights on environmental impacts associated with their supply chain processes. However, this information is typically stored in disparate locations, often hidden within departmental documents or applications. Additionally, there is usually no standardized vocabulary used across different industries, leading to inconsistent understandings of key business and supply chain concepts. Graphs reconcile such data continuously crawled from diverse sources to support interactive queries and provide a graphic representation or model of the elements within supply chain, aiding in pathfinding and the ability to semantically enrich complex machine learning (ML) algorithms and decision making.
Real World Examples:
Aggregating Data to Reduce Carbon Footprints of Supply Chain for a Global Consultancy
“We are at a pivotal time in ESG where our clients are coming to us to answer questions like:
- What’s the best material we can use to package Product x?
- What shipping route is the most fuel efficient?
- Who was my most ESG compliant plant in 2020?”
Solution Outcomes: Graph embedded, machine-readable relationships between key supply chain and ESG concepts in a way that do not require tables and complex joins that enabled the firm to leverage their extensive knowledge base around methods to reduce environmental impact and guided them in building a centralized database of this knowledge. Consultants can leverage insights that are certified and align with industry standards to provide clients with a strategy that can generate profit while supporting sustainability mission and impact, detect patterns and provide market intelligence to their clients.
Use Case #4: Financial Risk Detection and Prediction
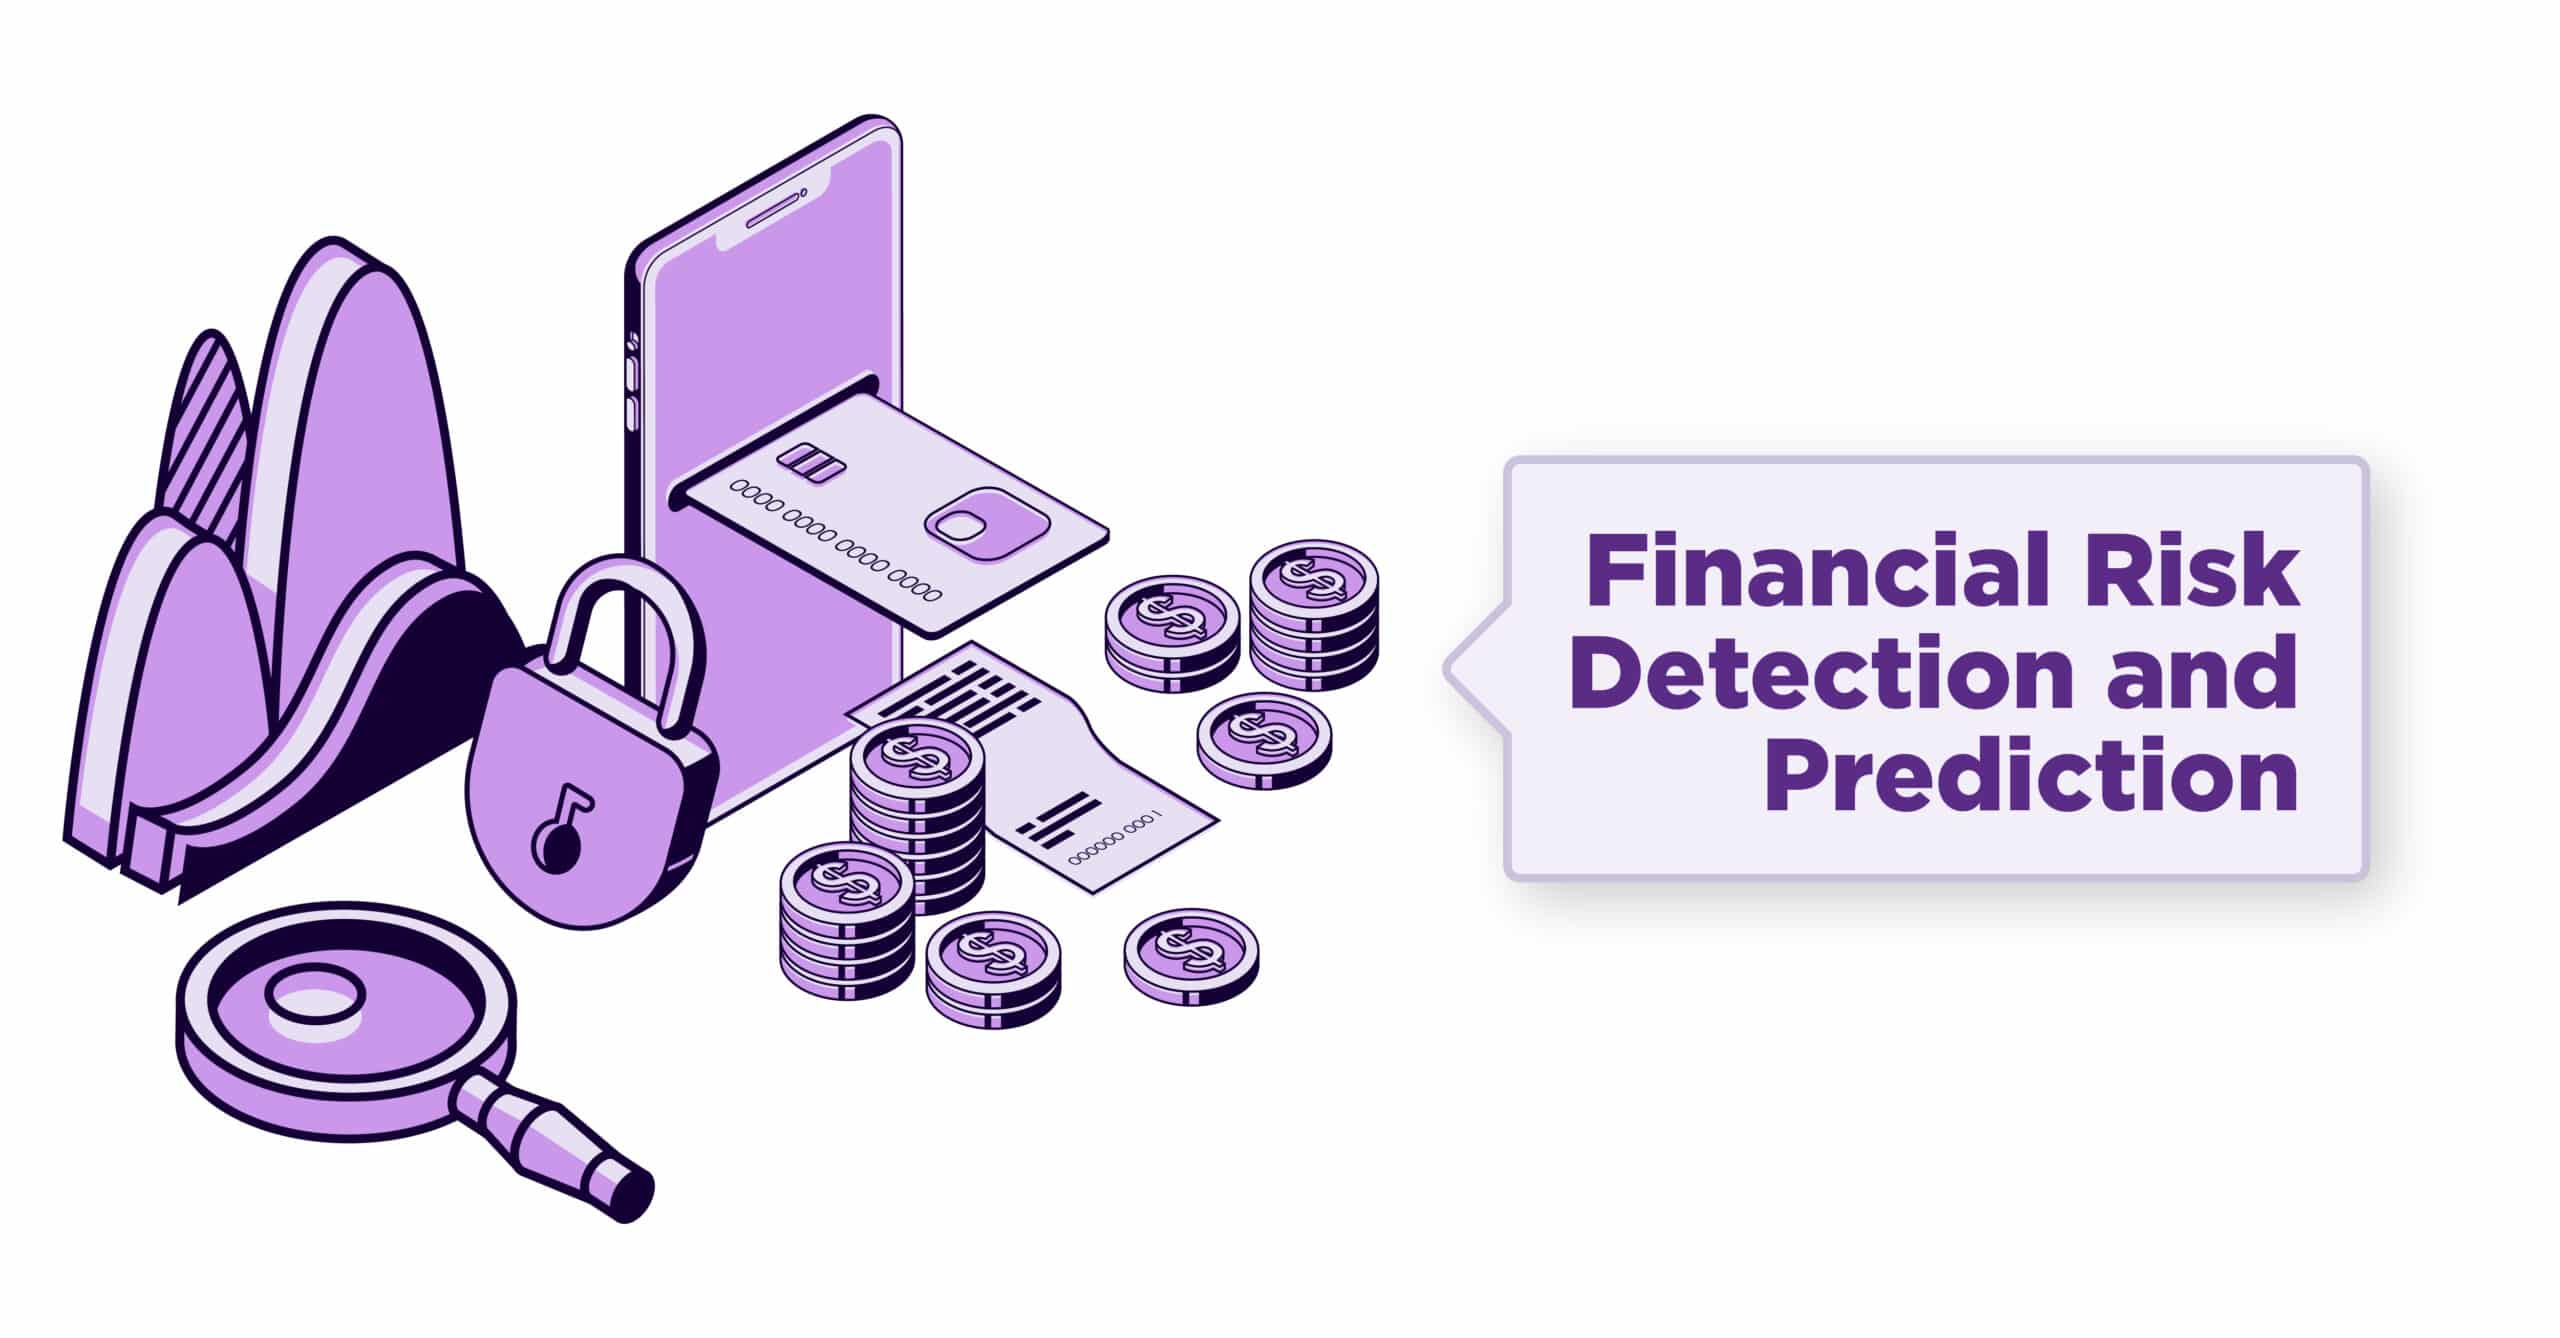 The financial industry is made up of a network of markets and transactions. A risk issue in one financial institution could result in a domino effect for many. As such, most large financial organizations have moved their data to a data lake or a data warehouse to understand and manage financial risk in one place. Yet, the biggest challenge for risk analysis continues to suffer from lack of a scalable way of understanding how data is interrelated. A graph or network is enabling institutions to model and visualize these connections as a collection of nodes and points that specifies the exact link between certain financial concepts and entities. Graph-based solutions further leverage the relationships among the entities involved to create a semantically enhanced machine learning model.
Real World Examples:
Financial Risk Reporting for a Federal Financial Regulator
“Data scientists and economists were finding it difficult to make efficient use of siloed data sources in order to easily access, interpret, and regulatory functions including answering questions like:
- What are the compliance forms and reporting requirements for Bank X?
- Which financial institutions have filed similar risk compliance issues?
- Which financial institutions are behind on their risk reporting and filings this year?
- What’s the revision history and the corresponding policies and procedures for a given regulation?”
Realtime Fraud Detection For Multinational e-Commerce Company
“We want to tap into our extensive historic listing data to understand the relationship between packages being rerouted, listings, and merchants to ultimately detect shipping scams so that we can minimize the fraud risk for online merchants from ‘unpaid’ and fraudulent purchases on their listing items.”
Solution Outcomes: Graph data that enables explorations, linking and understanding of entities such as product, categories/customer, orders that supports risk fraud pattern detections for the organization’s risk engine algorithm. Ultimately resulting in:
- Real-time risk fraud detection: Risk fraud pattern detections for risk engines to onboard.
- A non-disruptive fraud prevention: Help the company identify and truncate fraudulent transactions before they take place without impacting legitimate business transactions.
Use Case #5: Mergers and Acquisitions
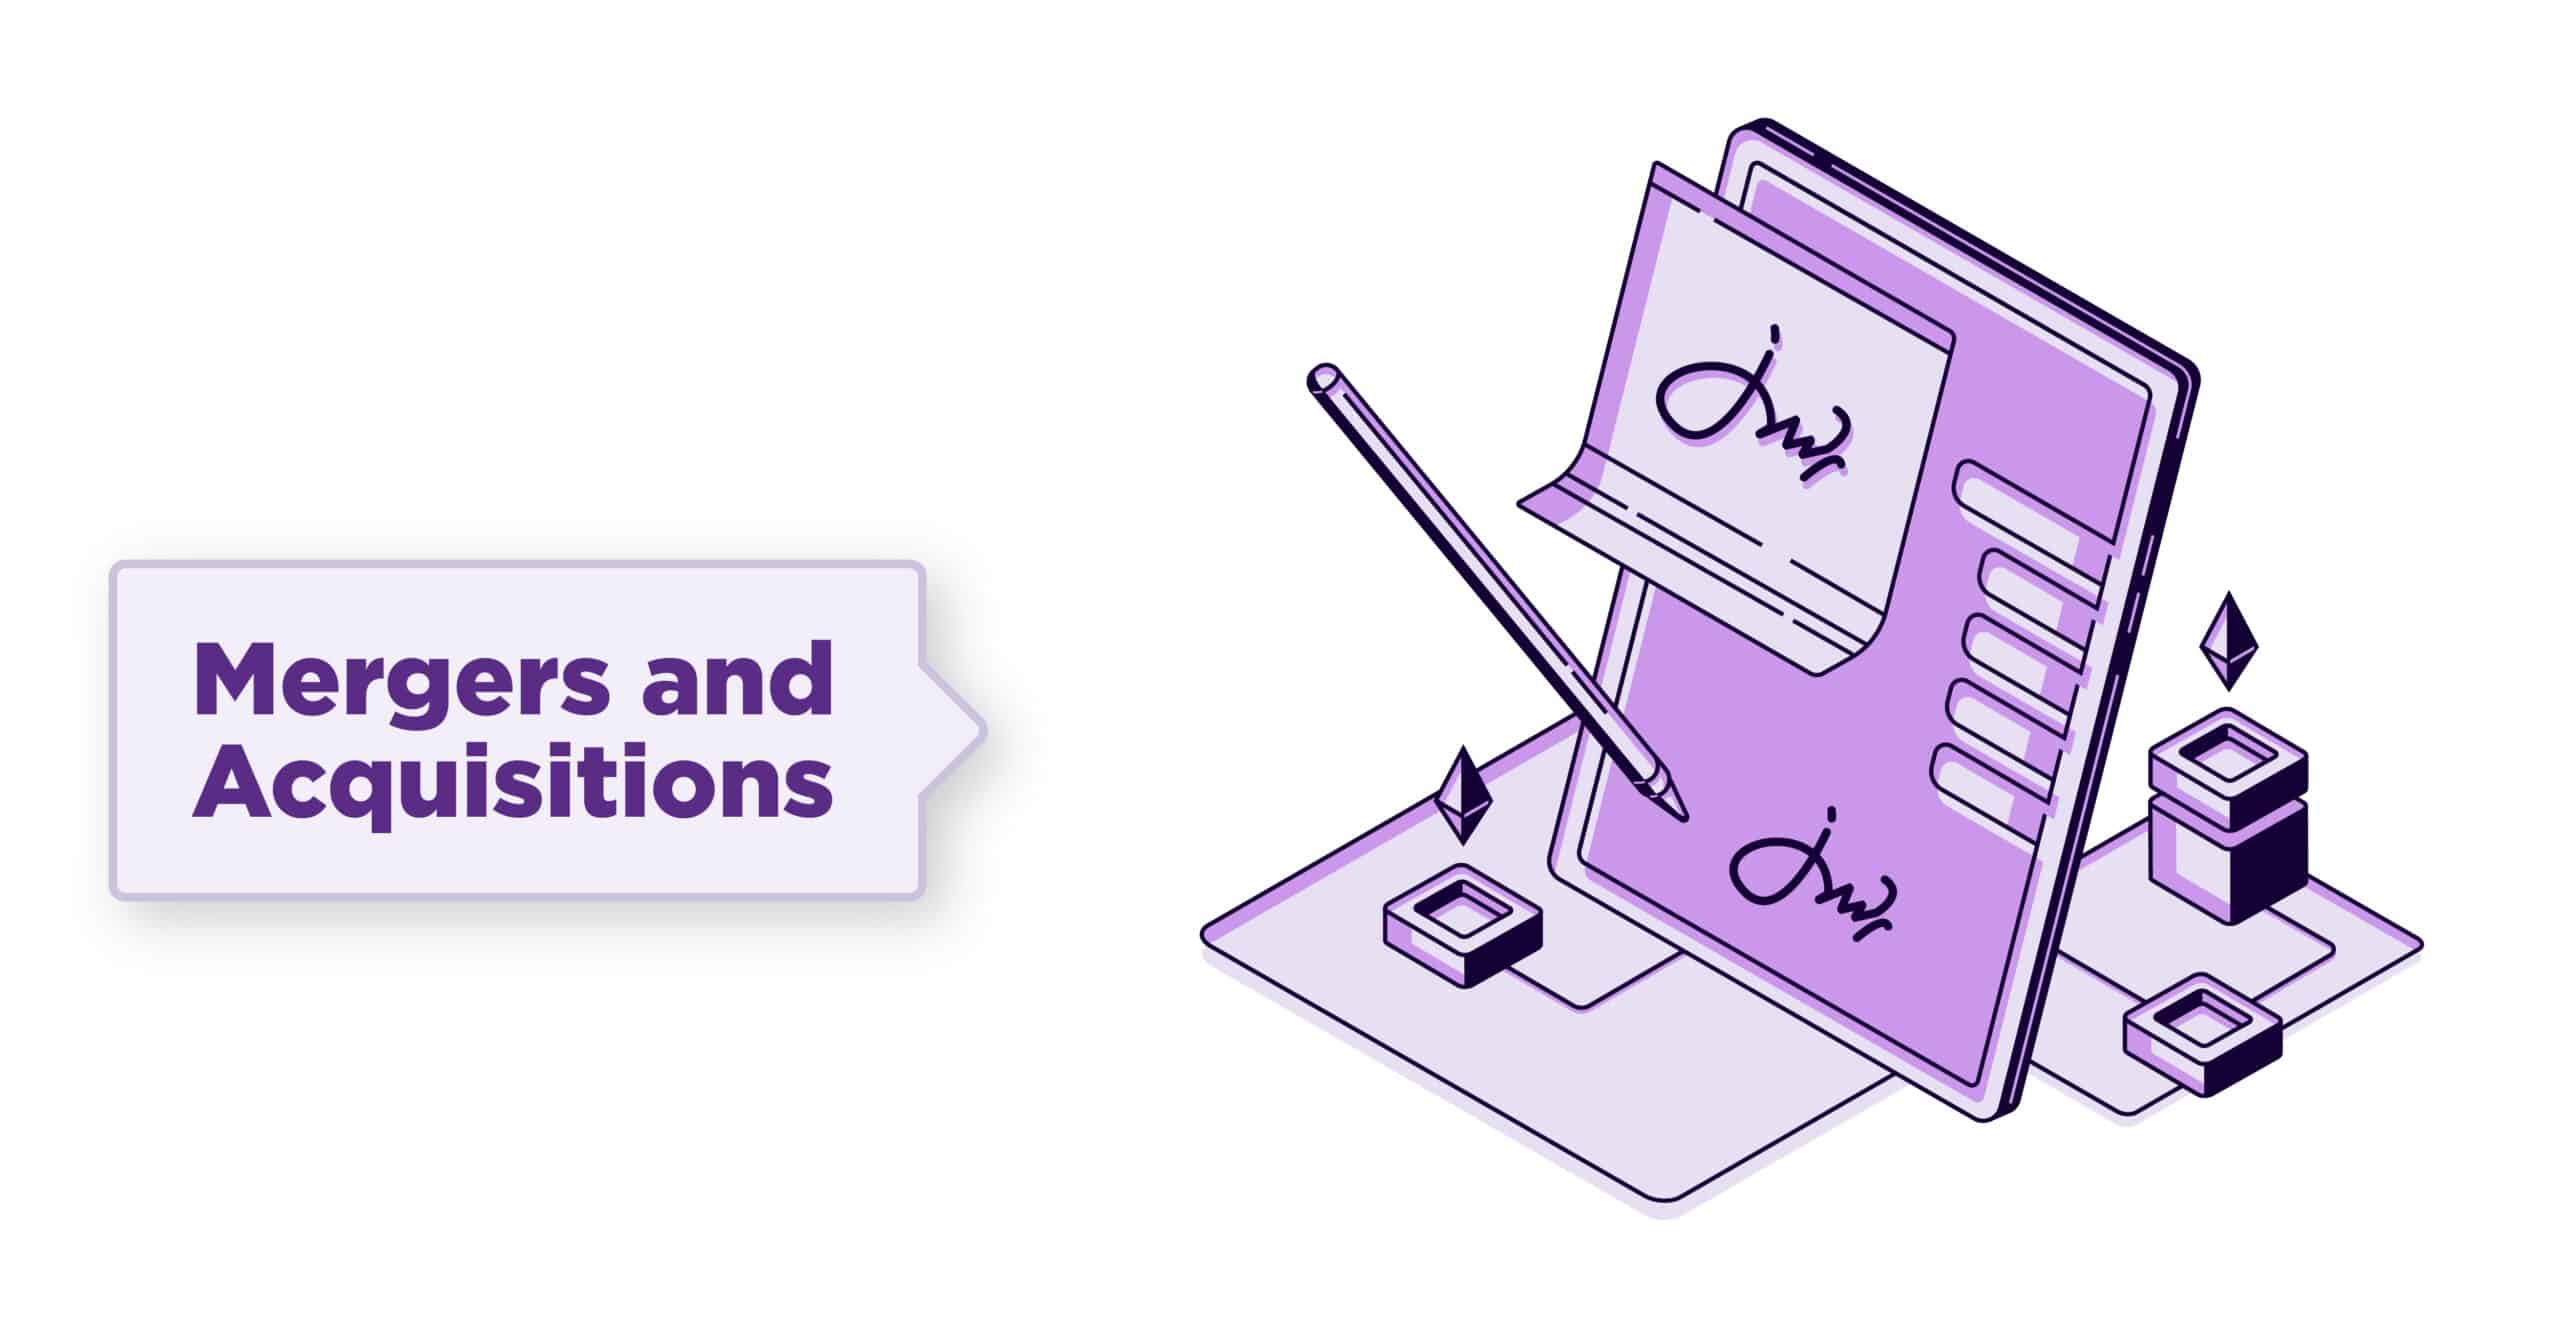 Many factors can impact the success of mergers and acquisitions (M&A) and their successful integration as merging with or acquiring new companies inevitably brings another ecosystem of applications, operations, data/content, and vernacular. The process of knowledge transfer and the challenge to enable strategic alignment of processes and data is becoming a rising concern to the already delicate success of M&As. For a knowledge graph, data relationships are first class citizens. Thus, graphs offer ways to semantically harmonize, store, and connect similar or related organizational concepts. The approach further represents information in the way people speak using taxonomies and ontological schemas that allow for storing data with organizational context.
Real World Examples:
Product/Solution Alignment for the World’s Leading Provider of Content Management and Intellectual Property Services
“We have gone through multiple M&As over the past 5 years. We are looking for a way to connect and standardize the data we have across 40 systems that have some overlapping applications, data, and users.”
“On our e-commerce platforms, it’s not clear what our specific products or solutions are. We are losing business due to our inability to consistently name and describe our solution offerings across the organization. How can we align our terminology on our products and solutions company wide?”
Solution Outcome: Graph solution allows for explicitly capturing and aligning the knowledge and data models by providing a comprehensive and structured representation of entities and their relationships. This is aiding in the due diligence process by allowing for the quick identification and analysis of key stakeholders, competitors, and potential synergies. Additionally, the graph serves as a useful tool for gaining a better understanding of the complexities involved in mergers, facilitates the deduplication of work or loss of information and intelligence across and enables context-based decision making.
Use Case #6: Data Quality and Governance
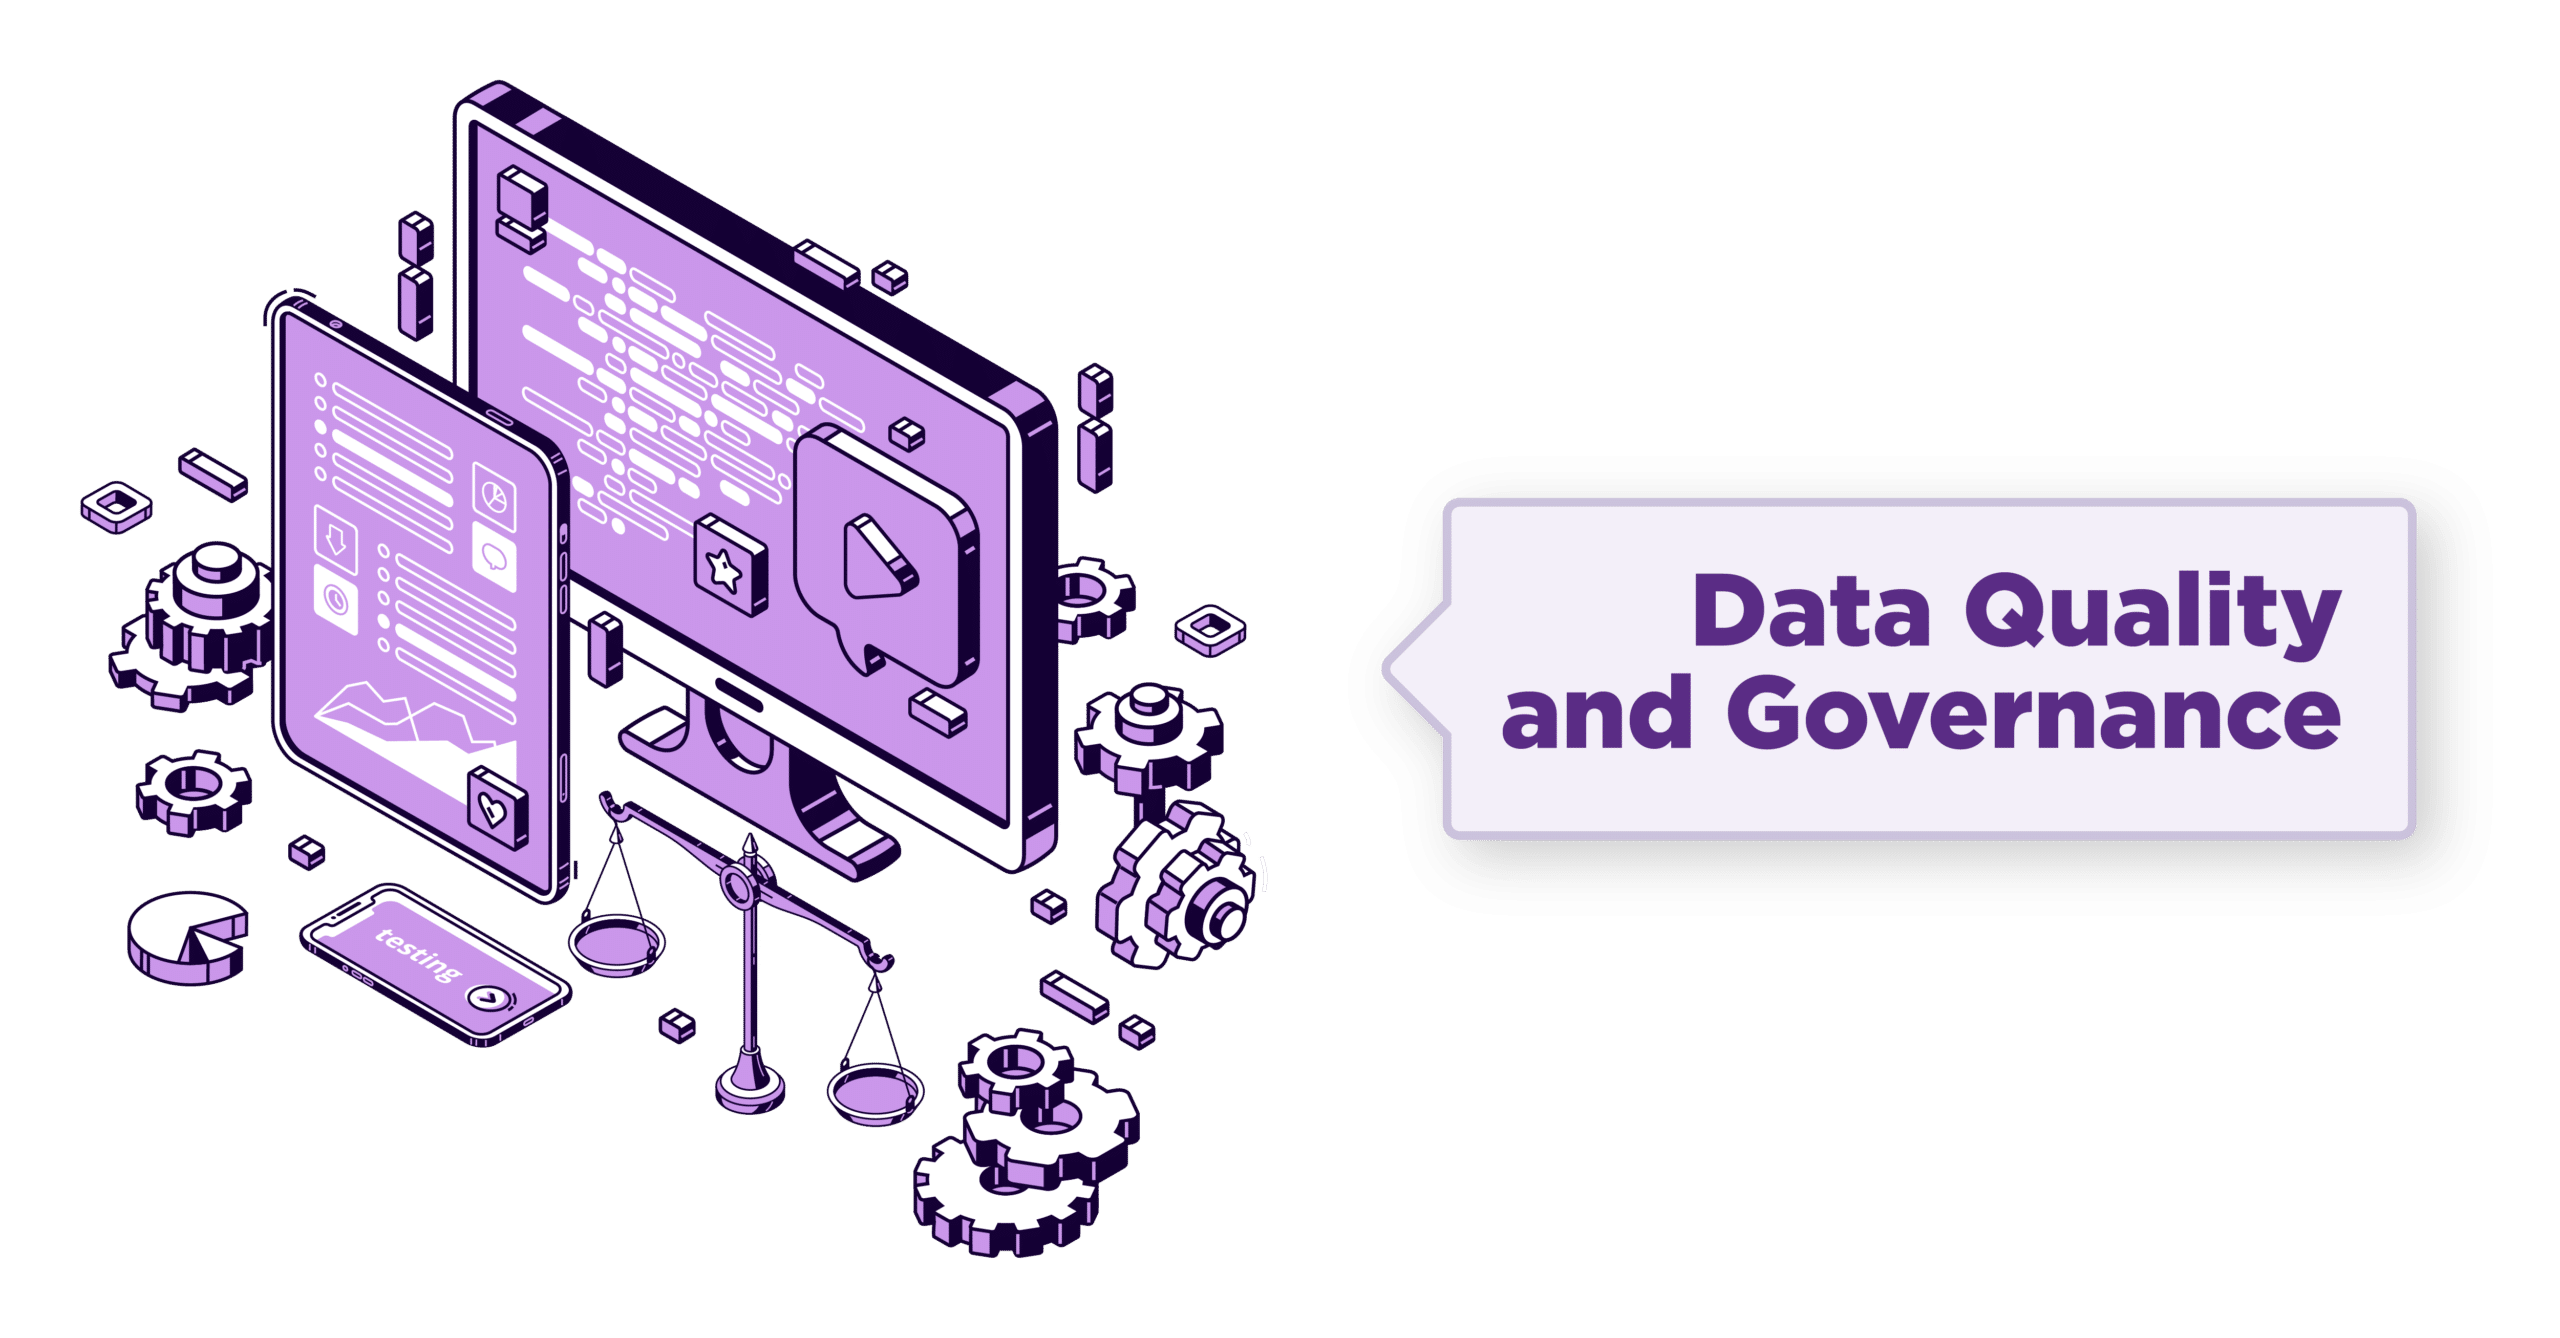 The size and complexity of data sources and datasets is making traditional data dictionaries and Entity Relationship Diagrams (ERD) inadequate. Knowledge Graphs provide structure for all types of data – either serving as a semantic layer or as a domain mapping solution – and enable the creation of multilateral relations across data sources, explicitly capturing how the data is being used, and what changes are being made to data. As such, knowledge graphs support data governance and quality inspection by providing a contextual understanding of enterprise data, where it is, who can access it and where, and how it will be shared or changed over time. As such, data governance strategies that are leveraging knowledge graph solutions have increased data accessibility and improved data quality and observability at scale.
Real World Examples:
Graph for Data Quality at a Global Digital Marketer
“Our enterprise has over 20 child organizations that:
- Lack transparency over which common data sets were available for use,
- Did not understand the quality of the data available,
- Have drastically different definitions of key terms, and
- Use a database of consumer data containing over 10 billion records, with dirty data and millions of duplicates.”
Solution Outcome: A Graph creation and mapping process alone reduced record count from ~10 billion to ~4 billion with matching algorithms that optimized QA process resulting in 80% record deduplication with 95% accuracy.
Use Case #7: Data as a Product (and Data Interoperability)
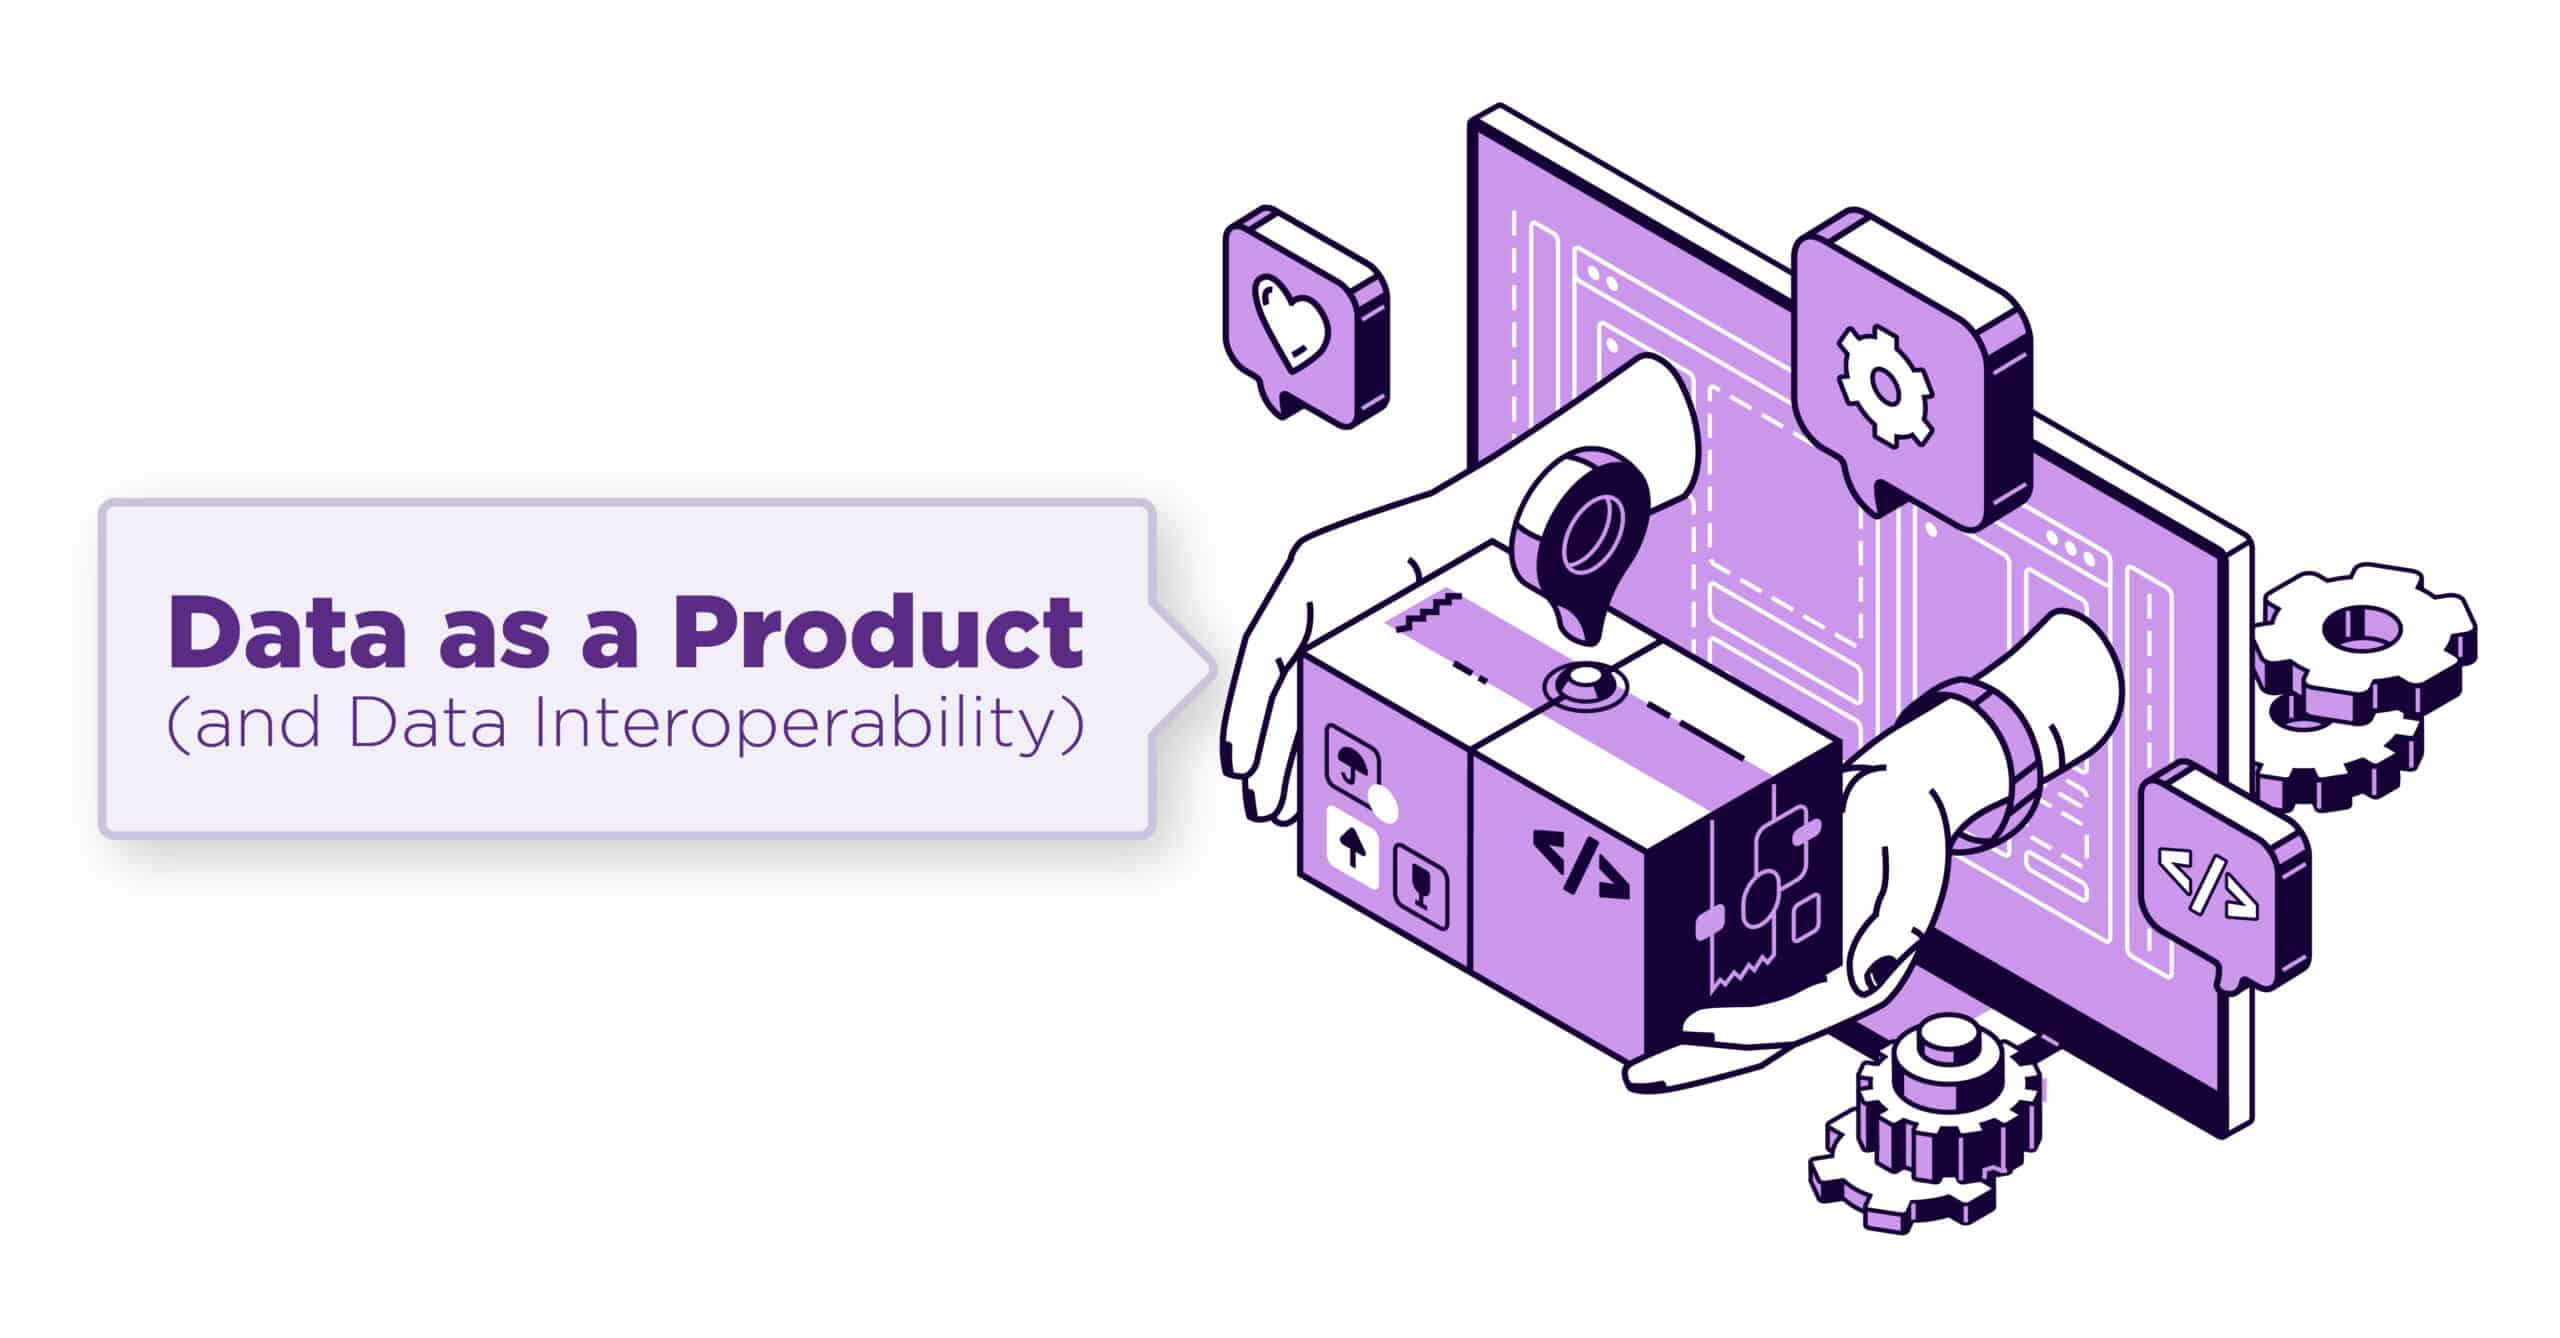 Every enterprise data strategy strives to facilitate the flexibility that will allow data to move between current and future systems, minimize limitations of proprietary solutions and avoid vendor lock. To do so, data needs to be created based on a shared terminology, web standards, and security protocols. The Financial Industry Business Ontology (FIBO) from the EDM Council is an example of a conceptual graph model that provides common vocabulary and meaning for key concepts and terms for the financial industry and a way to align and harmonize data irrespective of its source. As a standards’- based data model, graphs allow for consistent ingestion of diverse information types from sources internal or external to the organization (e.g. Linked Data, subscriptions, purchased datasets, etc.). Ultimately allowing organizations to handle large data coming from various sources, including public sources and boost knowledge discovery, industry compliance, and efficient data-driven analytics.
Real World Examples:
Data-as-a-Product for Global Veterinary that Provides a Comprehensive Suite of Products, Software, and Services for Veterinary Professionals
“Most of our highly interrelated data is stuck behind 4-5 legacy data platforms and it’s hard to unify and understand our data which is slowing down our engineering processes. Ultimately, we need a way to model and describe business processes and data flow between individual veterinary practices and enrich and align their data with industry standards. This will allow us to normalize services, improve efficiency and create the ability to report on the data across practices as well as trends within a specific practice.”
Solution Outcome: Taxonomy/ontology was used as a schema to generate the graph and to describe the key types of ‘things’ vet partners were interested in and how they relate to each other. This is ensuring the use of a common vocabulary from all veterinary practices submitting data and resulting in:
- Automation of data normalization,
- Identification of potential drug targets and understanding the relationships between different molecules, and
- Enablement of the company to provide the ontological data model as a product and a shareable industry standard
Use Case #8: Semantic Search
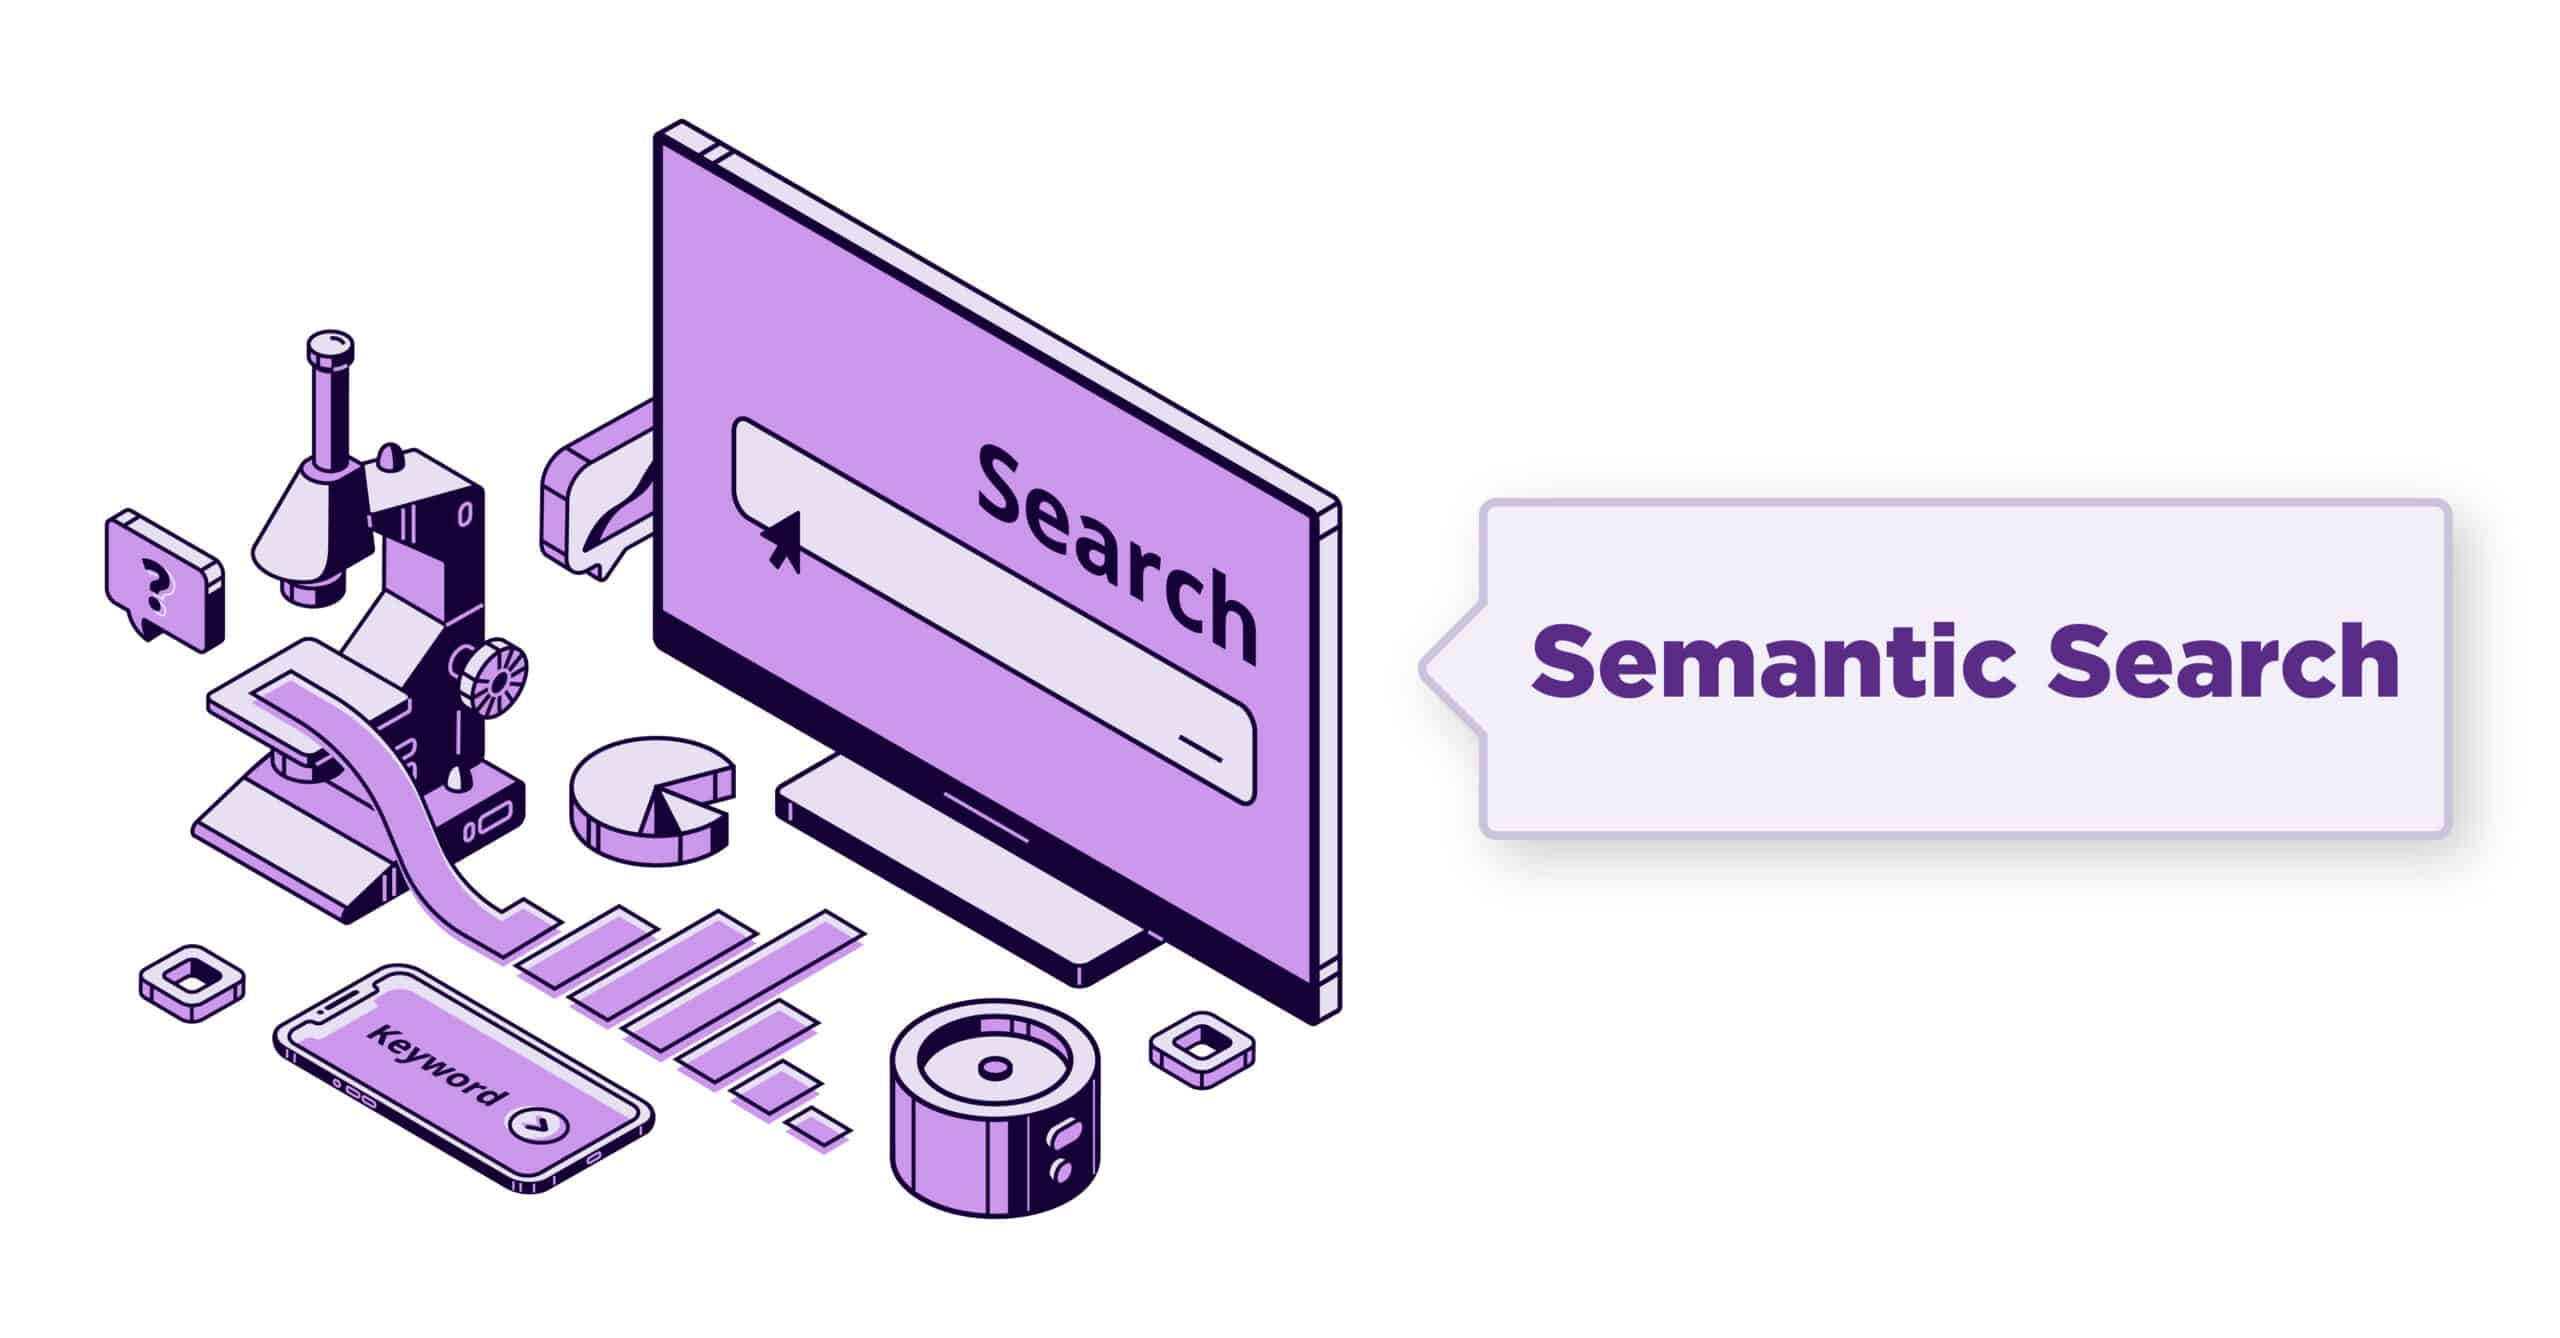 “Search doesn’t work” usually is a common sentiment at organizations that are only leveraging key words to determine what search results should look like. Semantic search, at its core, is a Search that provides results based on context and meaning. Search relevance, or a search engine’s ability to find and return a page of search results to user intent, isn’t possible without semantic understanding. Knowledge graphs thus create a machine-readable structure that will allow systems to explicitly capture context and thus search engines to understand concepts, entities and the relationships between them.
Today, many of the search engines we use such as Google, Amazon, Airbnb, etc., all leverage multiple knowledge graphs, along with natural language processing (NLP) and machine learning (ML) to go beyond basic keyword-based searching. Understanding semantic search is becoming fundamental to providing a good search experience that’s rooted in a deep understanding of users and ultimately driving the intended digital experience that garners trust and adoption (be it knowledge transfer, enterprise learning, employee/customer retention, or increased sales).
Real World Examples:
Expert Finder for a Federal Engineering Research Institute
“We have a retiring workforce and are facing challenges with brain drain. We would like to be able to get quick answers to questions like:
- What type of paint did we use to manufacture this engineering part in 1956?”
Solution Outcomes: A graph model enables browsing and discovery of previously uncaptured relationships between people, roles, projects, organizations, and engineering materials to aggregate and return in search results. Providing a unified view of institutional information and resulting in reduced time to find an expert and project information from 3-4 weeks to 5-10 minutes.
Use Case #9: Context and Reasoning for AI and ML
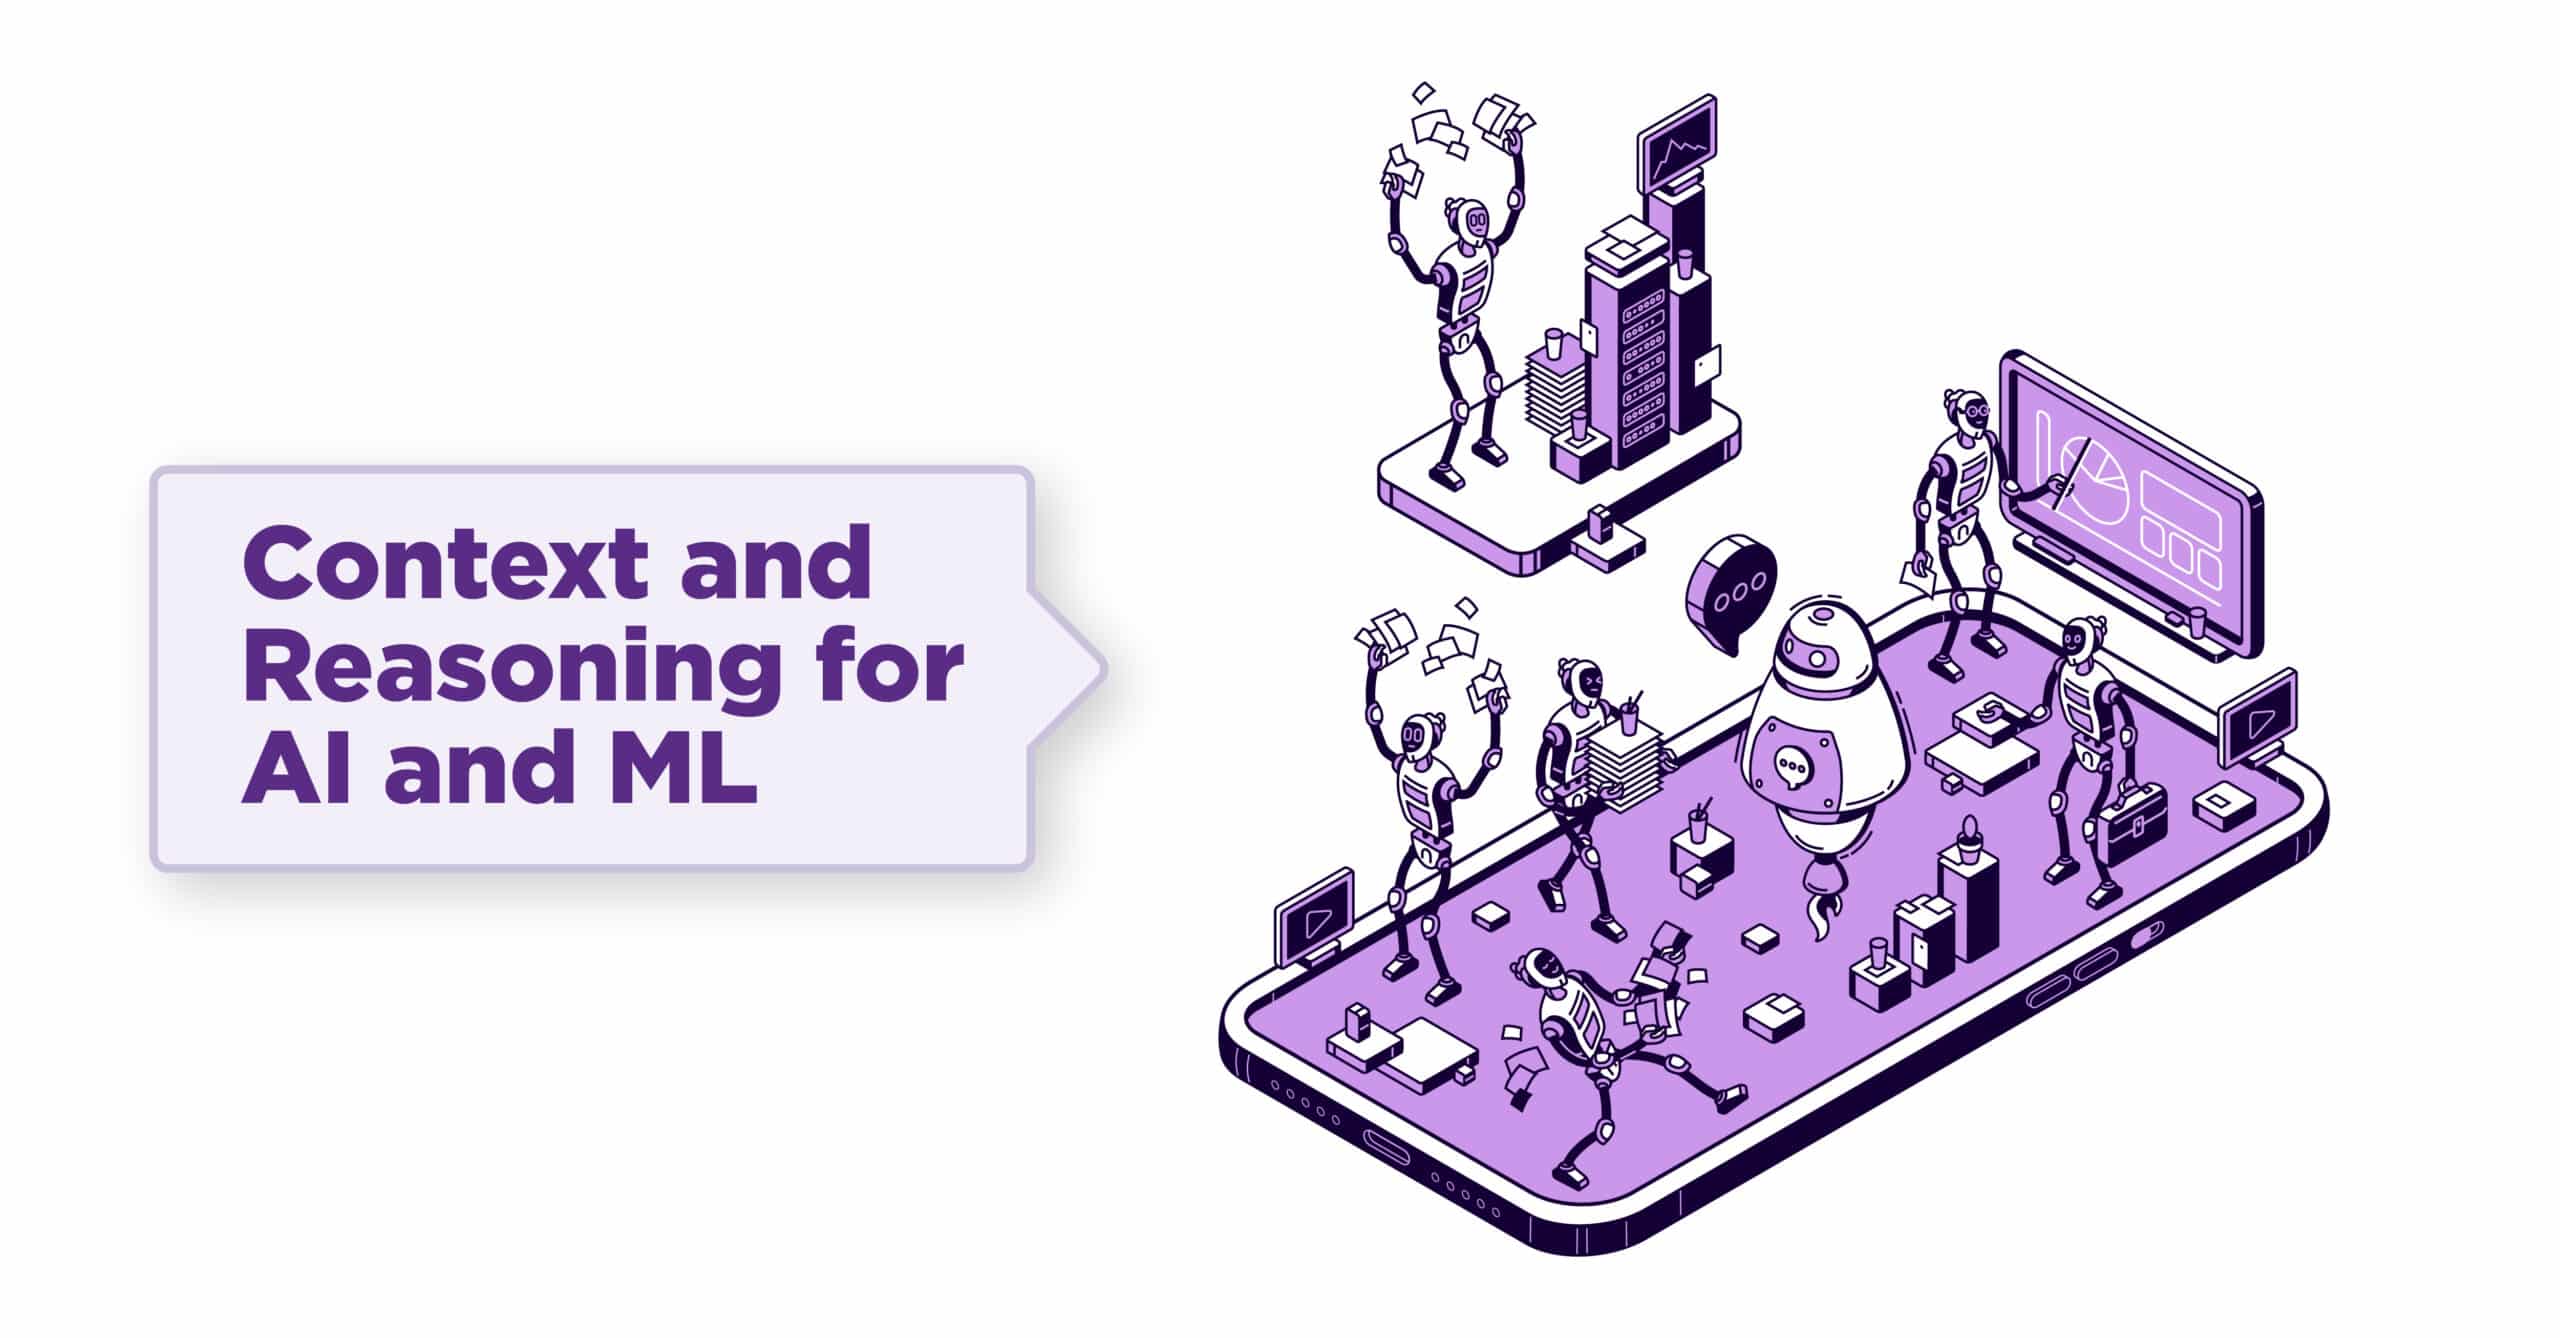 Most Enterprise AI projects are stalled due to lack of strategy to get data and knowledge. AI efforts had typically started with Data scientists getting hired to explore and figure out what’s in the data. They often get stuck after some exploration with fundamental questions like: what problem am I solving or how do I know this is good training data? This is resulting in mistakes in the algorithms, bad AI errors, ultimately lack of trust, and then abandonment of AI efforts. Data on its own, does not explain itself nor its journey. Data is only valuable in the context of what it means to end users. Knowledge graphs provide ML and AI a knowledge modeling approach to accelerate the data exploration, connection, and feature extraction process and provide automated data classification based on context during data preparation for AI and ML.
Real World Examples:
A Semantic Recommendation Service for a Scientific Products and Software Services Supplier
“We need to improve our ML algorithms to automate the aggregation of products and related marketing and manuals, videos, etc. to make personalized content recommendations to our customers investing in our products. This is currently a manual process that requires significant time investment and resources from Marketing, Products, IT. This is becoming business critical for us to manage at a global scale.”
Solution Outcomes: Graph provides a comprehensive and organized view of data, helping improve the performance and explainability of models, and automating several tasks. Specifically, the graph is supporting:
- Data integration/preparation: integrate and organize data from various sources such as marketing content platforms, Product Information management (PIM) application and more making it easier for ML and AI models to access and understand the data by encoding context through metadata and taxonomies.
- Automation: support the automation of tasks such as data annotation, data curation, data pre-processing and so on, which can help save time and resources.
- Explanation: a way to understand and explain the decisions made by ML and AI models, increasing trust and transparency.
- Reasoning: the graph is used to perform reasoning and inferences, which help the ML and AI algorithms to make more accurate predictions on content recommendations.
- Personalization: using the knowledge graph, AI is extracting user’s preference and behavior to provide personalized services for a given product.
For more details and use cases visit Enterprise Knowledge.