
Over 80% of enterprise data remains unstructured, and with the rise of artificial intelligence (AI), traditional relational databases are becoming less effective at capturing the richness of organizational knowledge assets, institutional knowledge, and interconnected data. In modern enterprise data solutions, graphs have become an essential topic and a growing solution for organizing and leveraging vast amounts of such disparate, diverse but interconnected data. Especially for technical teams that are tasked with making AI “work” or provide value for their organization, graphs offer a programmatic way for explicitly modeling relationships between various data entities, providing business context to tabular data, and extracting knowledge from unstructured content – ultimately delivering what we call Knowledge Intelligence.
Despite its growing popularity, misconceptions about the scope and capabilities of different graph solutions still persist. Many organizations continue to struggle to fully understand the diverse types of graphs available and their specific use cases.
As such, before investing into the modeling and implementation of a graph solution, it is important to understand the different types of graphs used within the enterprise, the distinct purposes they serve, and the specific business needs they support. There are various types of graphs that are built-for-purpose but the top most common categories are metadata graphs, knowledge graphs, and analytics graphs. Collectively, we refer to these as a “semantic network” and the core components of a semantic layer as they all represent interconnected entities with relationships, allowing for richer data interpretation and analysis through the use of semantic metadata and contextual understanding – essentially, a network of information where the connections between data points hold significant meaning.
The most common misconceptions with graph solutions:
- It’s just a fancy network visualization;
- It’s another application or database;
- It’s a replacement for existing data warehouses;
- Only works with network-like data or is only useful for network analysis use cases;
- Only good for AI applications;
- Automatically transforms data without effort or without the need for domain expertise; and
- Large scale is always necessary.
Below, I explore these most common types of graphs, their respective use cases, and highlight how each can be applied to real-world business challenges.
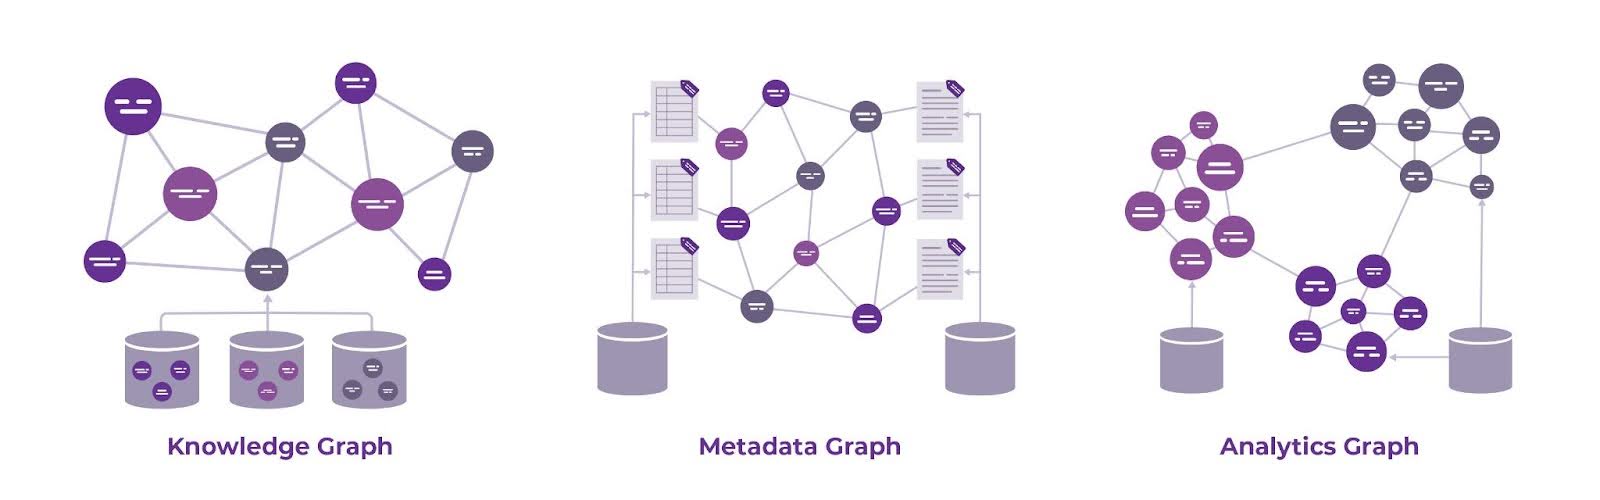
- Knowledge Graph: Organizes and links information based on its business meaning and context. It represents organizational entities (e.g., people, products, places, things) and the relationships between them in a way that is understandable both to machines and humans. By integrating heterogeneous data from multiple touchpoints and systems into a unified knowledge model, it serves as a knowledge and semantic abstraction layer over enterprise data, where relationships between different datasets are explicitly defined using ontologies and standards (e.g., RDF, OWL).
- When to Use: A knowledge or semantic graph is best suited for semantic understanding, contextualization, and enriched insights. It is a key solution in enterprise knowledge and data management as it allows organizations to capture, store, and retrieve tacit and explicit knowledge in a structured way and provide a holistic view of organization-specific domains such as customers, products, services, etc. ultimately supporting customer 360, sales, marketing, and knowledge and data management efforts. Additionally, enterprise knowledge graphs power AI capabilities such as natural language processing (NLP) and autonomous but explainable AI agents by providing context-aware knowledge that can be used for machine-specific tasks like entity recognition, question answering, and content and data categorization. RDF-based tools such as Graphwise – GraphDB, Stardog, etc. enable the scale and efficiency of knowledge graph modeling and management.
- When to Use: A knowledge or semantic graph is best suited for semantic understanding, contextualization, and enriched insights. It is a key solution in enterprise knowledge and data management as it allows organizations to capture, store, and retrieve tacit and explicit knowledge in a structured way and provide a holistic view of organization-specific domains such as customers, products, services, etc. ultimately supporting customer 360, sales, marketing, and knowledge and data management efforts. Additionally, enterprise knowledge graphs power AI capabilities such as natural language processing (NLP) and autonomous but explainable AI agents by providing context-aware knowledge that can be used for machine-specific tasks like entity recognition, question answering, and content and data categorization. RDF-based tools such as Graphwise – GraphDB, Stardog, etc. enable the scale and efficiency of knowledge graph modeling and management.
- Metadata Graph: Captures the structure and descriptive properties of data by tracking business, technical, and operational metadata attributes, such as process, ownership, security, and privacy information across an organization, providing a unified repository of metadata and a connected view of data assets.
- When to Use: A metadata graph is best used for managing and tracking the metadata (data about data) across the enterprise. It helps ensure that data is properly classified, stored, governed, and accessible. As such, it’s ideal for data governance, lineage and data quality tracking, and metadata management. Building a metadata graph simplifies and streamlines data and metadata management practices and is pertinent for data discovery, governance, data cataloging, and lineage tracking use cases. Advanced metadata modeling and management solutions such as data catalogs and taxonomy/ontology management tools (e.g., data.world, TopQuadrant, Semaphore, etc.) facilitate the development and scale of metadata graphs.
- When to Use: A metadata graph is best used for managing and tracking the metadata (data about data) across the enterprise. It helps ensure that data is properly classified, stored, governed, and accessible. As such, it’s ideal for data governance, lineage and data quality tracking, and metadata management. Building a metadata graph simplifies and streamlines data and metadata management practices and is pertinent for data discovery, governance, data cataloging, and lineage tracking use cases. Advanced metadata modeling and management solutions such as data catalogs and taxonomy/ontology management tools (e.g., data.world, TopQuadrant, Semaphore, etc.) facilitate the development and scale of metadata graphs.
- Analytics Graph: Supports analytics by connecting and modeling relationships between different data entities to uncover insights and identify trends, patterns, and correlations – enabling users to perform sophisticated queries on large, complex datasets with interrelationships that may not be easily captured in traditional tabular models.
- When to Use: Graph analytics supports advanced analytics use cases, including in-depth data exploration to uncover relationships, enabling data analytics teams to identify trends, anomalies, and correlations that may not be immediately apparent through standard reporting tools. It also plays a critical role in recommendation systems by analyzing user behavior, preferences, and interactions. We have seen the most success when analytics graphs are used to power investigative analysis and pattern detection use cases in industries such as e-commerce, media, manufacturing, engineering, and fraud detection for financial institutions. Tools like Neo4j, a widely adopted graph database with property graph also known as Labeled Property Graph (LPG) algorithm capabilities for finding communities/clusters in a graph, facilitate the storage and processing of such large-scale graph data whereas visualization tools (like Linkurious or GraphAware Hume) help interpret and explore these complex relationships more intuitively.
Each type of graph, whether metadata, analytics, or knowledge/semantic, plays a critical role in enhancing the usability and accessibility of enterprise knowledge assets. One important consideration to keep in mind, especially when it comes to analytics graphs, is the potential lack of domain or knowledge graph integration.
| Analytics graphs are only as valuable as the data they represent. Without a strong understanding of the domain, analytics graphs can misinterpret the meaning of data relationships, leading to misleading or incomplete insights. Moreover, if the analytics team doesn’t work closely with subject matter experts (SMEs), the graph may not fully capture critical context or domain-specific nuances, reducing the effectiveness of its use. As such, analytics graphs are the most effective when grounded in and are preceded by knowledge graphs. |
Understanding the distinct functions of these graph types enables organizations to effectively leverage their power across a wide range of applications. In many of our enterprise solutions, a combination of these graphs is employed to achieve more comprehensive outcomes. These graphs leverage semantic technologies to capture relationships, hierarchies, and context in a machine-readable format, providing a foundation for more intelligent data interactions. For instance, metadata and knowledge graphs rely on RDF (Resource Description Framework) which is essential for structuring, storing, and querying semantic data, enabling the representation of complex relationships between entities – requiring semantic web standard-compliant technologies that support RDF such as triplestore graph databases (e.g., GraphDB or Stardog) and SPARQL endpoints to query RDF data.
Within a semantic layer, a combination of these graphs is used to organize and manage knowledge in a way that enables better querying, integration, and analysis across various systems and data sources. For example, with the financial institution client case study we briefly discussed above, their risk and compliance department is one of the key users of their semantic layer where a metadata graph is used in a federated approach to track regulatory data and compliance requirements across 20+ systems and 8+ business lines and helping to identify data quality issues in their knowledge graph. Meanwhile, the knowledge graph contextualizes this data by linking it to business operations and transactions – providing an end-to-end, connected view of their risk assessment process. The data and analytics team then utilizes an analytics graph to analyze historical data to support their ML/fraud detection use cases by using a subset of information from the knowledge graph. This integrated semantic layer approach is helping this specific organization ensure both regulatory compliance and proactive risk management. It demonstrates a growing trend and best practice where an enterprise knowledge graph provides a holistic view of enterprise knowledge assets, metadata graphs enable data governance, and analytics graphs support advanced and potentially transient analytical use cases.
Understanding your specific business needs and implementing an effective graph solution is an iterative process. If you are just embarking on this path, or you have already started and need further assistance with approach, design and modeling, or proven practices, learn more from our case studies or reach out to us directly.