As a complement to our enterprise search engagements with clients, we often end up exploring how the implementation of a knowledge graph can establish the foundation for more advanced KM and data efforts, such as smart search or AI capabilities like chatbots and recommender engines. However, while knowledge graphs are relatively easy to understand from a conceptual perspective, many organizations aren’t sure how a knowledge graph can specifically benefit them and their working processes. Applying semantic meaning to data? Great! But what does that look like?
Between the newness of this powerful technology and the limitlessness of how it can be applied, I’ve seen many organizations struggle to define exactly what they want a knowledge graph to do for them. To better communicate all that a knowledge graph can do, I’ve found wireframing/interface design and user experience flow definition activities to be powerful tools in helping our clients define what exactly they hope to get out of leveraging a knowledge graph. These interface designs are all the more helpful when they’re a result of collaborative design sessions with project stakeholders and subject matter experts (SMEs).
In this blog, I’ll be focusing specifically on how wireframing can help define knowledge graph-specific use cases from a search perspective, but know that knowledge graphs enhance a wide variety of KM-adjacent efforts at your organization and aren’t solely relegated to the realm of enterprise, asset-based search.
Defining Knowledge Graph Use Cases
As previously mentioned, an organization may be ready for knowledge graph implementation, but may not yet know why they need one or how they may benefit. Most simply, a knowledge graph imparts meaning to data and information, and from that point of view, the possible use cases can seem limitless. Consider the following use cases from a variety of our past clients spanning various industries:
1. As a researcher, I need to identify experts in a particular field by browsing related webinars, publications, conferences, committees, HR data, and other such entities, and be able to determine if I should invite that individual to join a committee.
2. As a lab equipment purchaser, I need to access all available content about a specific product category so that I can make the most informed buying decision possible.
3. As a data scientist, I need to see how various financial institutions replied to a specific question on the same regulatory form and be able to easily traverse the relationships that exist between the data, institutions, and other such forms.
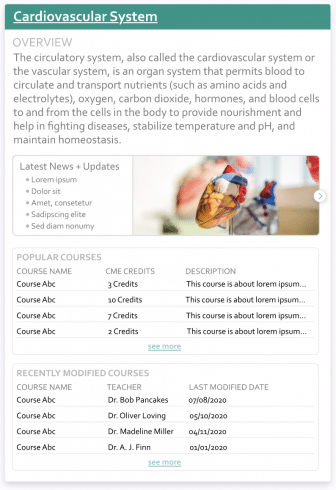
 From the search perspective, facilitated collaborative design sessions can not only define the appearance and interaction points of various knowledge graph-supported functionalities, but can also facilitate the discovery of the types of questions and answers users are expecting to address and access via these functionalities. Understanding the users’ goals allows us to structure, model, and build the data in a way that is best able to answer those questions. Search enhancements like action-oriented results and knowledge panels can serve as a great stepping stone to defining use cases that are increasingly specific to your organization and the particular needs of your users.
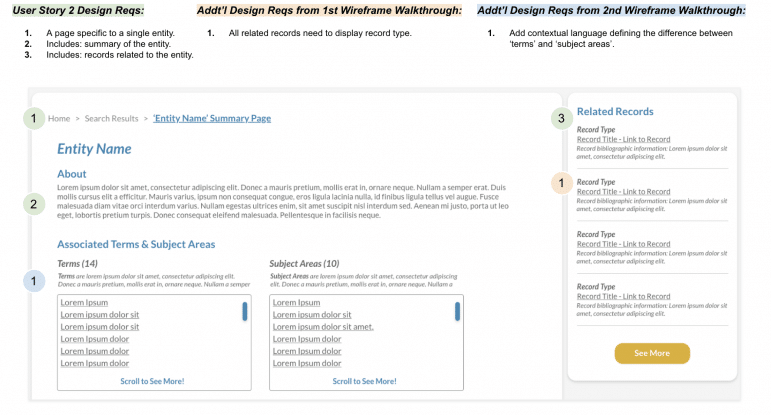
Additionally, some of these initial design sessions can clarify what the knowledge graph shouldn’t do. For example, in recently collaborating with a provisioner of scientific instrumentation, software, and services, a design session started with the intention of defining the information assets and data entities to be represented in knowledge panels (meant to appear alongside search results). As part of that same session, search aggregator pages were also drafted and designed to feature any and all information, both knowledge- and product-specific, pertaining to a particular scientific technique. As the session continued, use cases better suited to the client’s goals materialized, and another series of wireframes, this time featuring a variety of page recommenders and topic classifiers, were devised to address those needs.
Identify Knowledge Graph-Supported Functionalities
Similar to use case identification, design sessions can also play a significant role in feature or functionality identification. There are not only many forms via which a knowledge graph’s data can be presented, but a limitless variety of ways of which that data can be collated, organized, and ultimately presented. Oftentimes, feature and functionality definition happens alongside use case definition and interface design, as use cases define the user’s action and its associated goal, and the interface’s built-in functionality maps how that goal will be achieved.
At this step in the process of knowledge graph-focused use case definition, there’s often some necessary data assessment work that needs to happen. Now that knowledge graph-specific use cases have been identified, the quality and availability of the data to be accessed by the graph and presented in the interface must be assessed so that the feasibility of implementation can be measured and it can be ascertained whether or not a data clean-up process is required.
Examples of Knowledge Graph Design in Practice
Below are two abbreviated examples of how EK used design sessions to define and meet user needs as they related to knowledge graph-supported functionalities and features.
Example 1
For a nonprofit and nongovernmental research organization, designs and use cases were iterated upon in parallel. While the project continued, both the designs and use cases shifted as a result of both an iterative approach, which allowed us to surface additional stakeholder thoughts and concerns, and upon discovering that the quality of the featured data was found to be in need of some necessary clean-up or was otherwise missing. Both to ensure that the project was delivered on time and that the expectations of the knowledge graph were defined and met, design-to-use-case mapping became a regular part of the working project cadence. For example, after each design walkthrough where additional requirements were identified or a use case was refined, those changes to the use case in question were mapped to the wireframe, allowing all project members to visually track how the proposed interface supported a use case, regardless of how much that use case may have changed. Mapping the goals of the use cases to specific actions and processes supported by the interface ensured that the project team’s forward momentum remained user focused and feasible. These design validation sessions also allowed for EK to simultaneously train and educate project stakeholders as to how they could use wireframes to demonstrate the values of a knowledge graph throughout their organization.
Example 2
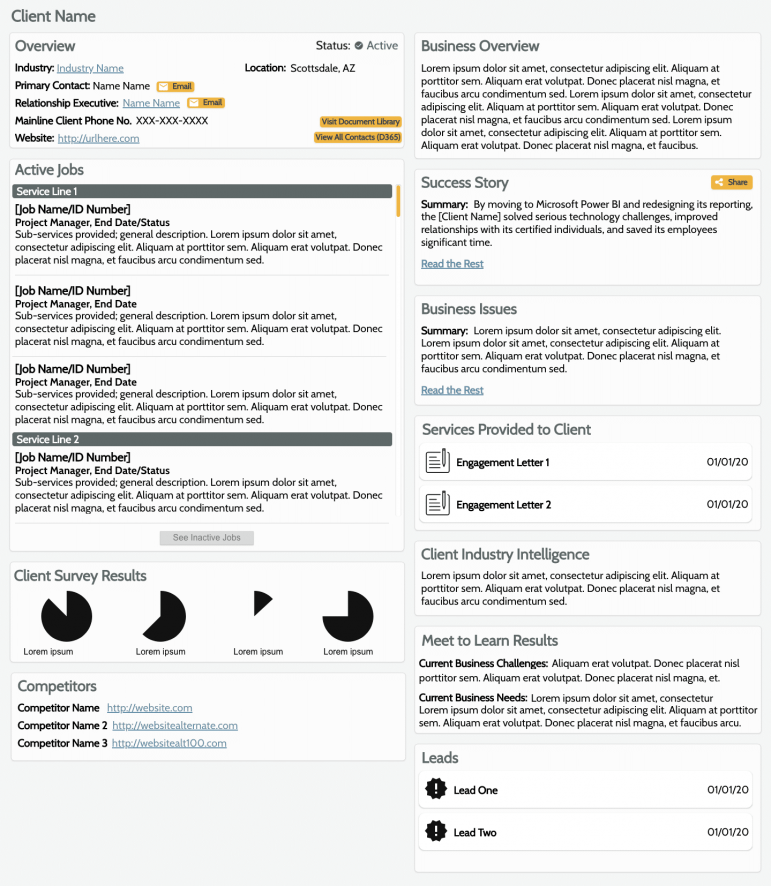
At an accounting and tax services firm, staff were unable to see any and all content related to a specific client, and this was exacerbated by that content taking many forms, such as survey results and individual documents. To address this need, EK led a series of iterative design sessions to identify the types of data to be featured in both action-oriented results and search aggregator pages. Conducting these sessions in an iterative manner means that each consecutive group of participants provides feedback, and builds, on the inputs supplied by the previous session. At the end of a series of these sessions, the resulting designs have been both refined and validated multiple times by participants’ peers. For example, we worked with stakeholders across the organization to design the client page (featured here) which aggregates information from the organization’s content, HR, and CRM systems to ensure that employees could easily access information like engagement letters, active jobs, survey results, industry intelligence, and more, all as they related to that specific client. Iterative design via collaborating with individuals across the organization allowed us to identify all of these different types and sources of data and information.This repeatable process of refining and validating allows EK to confidently understand how a knowledge graph should be constructed, while also providing a sense of security to project stakeholders in the fact that the recommendations are exactly what the users are expecting and from which they’ll find guaranteed value.
Example of a search aggregator page iteratively designed by workshop participants.
Conclusion
As you can see, there are a variety of decisions to make prior to implementing a knowledge graph, and design sessions with a focus on wireframing can help define the use cases, interface, and necessary features and functionalities to be supported by that interface. Design workstreams running parallel or prior to development/integration efforts ensure that those efforts are directed towards a high-value goal and ultimate increased return on investment. If your organization is ready to explore the benefits of knowledge graph implementation but isn’t sure where to start, reach out to us.


