
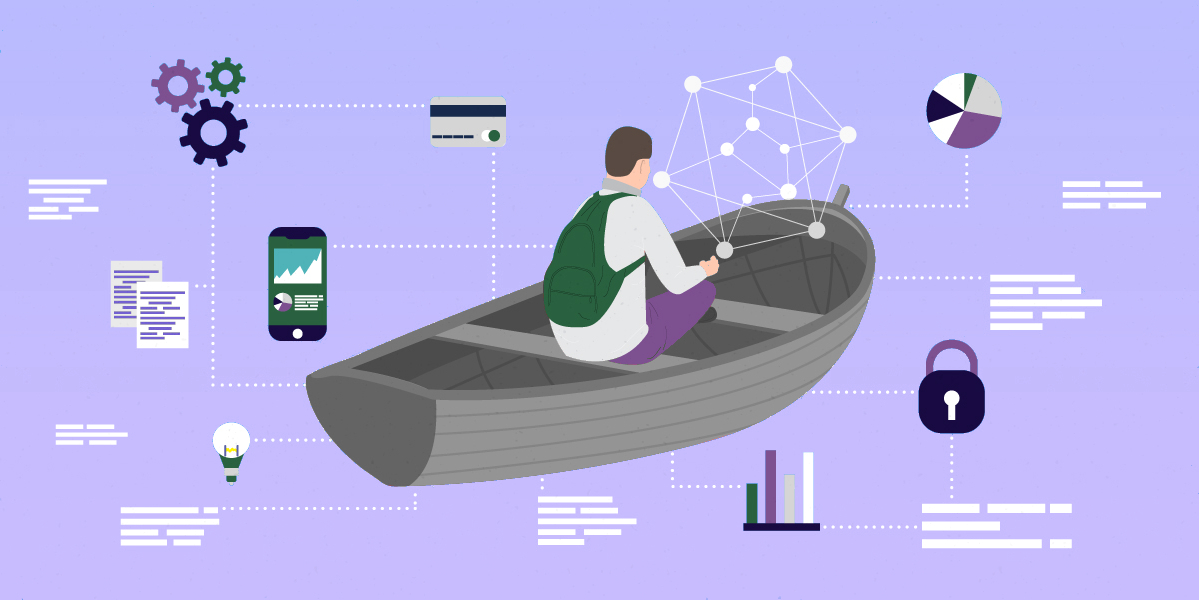
At EK, we know knowledge graphs are the best tool for mastering data governance at organizations. This whitepaper details the key principles and challenges of data governance and demonstrates how using knowledge graphs can ensure successful data governance.
Data governance helps companies better use data and information to improve the quality of decisions, products, and other tasks within the organization. It serves an audit function for data and information management that provides oversight for the:
- Assessment of data value and quality,
- Correct and efficient organization of data,
- Defining of data,
- Ownership and production of data,
- Increasing the use of data,
- Lowering data management costs,
- Security requirements, and
- Risks around complying with business and legal rules.
Effectively addressing the type of data sources, the roles associated with them (owners, consumers), and the way that data is delivered and accessed by various use groups allows data governance to increase the consistency, quality, and trustworthiness of data. It treats data as more than an input to business processes or a byproduct of business activity. Instead, data is seen as a business asset in and of itself. In today’s world, being “data-driven” is an expectation rather than a differentiator. Effective data governance makes the difference between an industry leader and its peers.
Why Data Governance?
Data governance helps to ensure that data management practices are achieving desired results. Data management practices can go awry in many ways as organizations face common challenges in effectively using data. The following sections offer different perspectives and examples of why data governance matters.
Resolving Missing Context and Data Silos
Often, the downstream use cases for data do not align neatly with its production and storage processes i.e. centralization, integration, and/or format.
One example of this problem is the formation of data silos. A data silo exists where useful data for a specific need is divided across various databases and divisions. Developers, analysts, and other users need an intuitive way to piece together all of the data that they need into a single resource. They also need multiple means of accessing that data and a way to understand the meaning of the data. Downstream users do not always have the same expertise as the people who generate the data. This creates the risk of these users not understanding what data is available and relevant to their needs.
Even when users understand the meaning of the data, it may be stored or modeled in a form that is not easy to use or integrate with other data sources. This problem is especially severe for unstructured or semi-structured data. Less structured data may take extra effort to make machine processable and portable for use in different use cases.
If there is no integrated resource to tie different data sources together, it will be that much more difficult to develop standard processes to drive effective data governance and data management practices at the enterprise level.
Tracking Ownership, Lineage, and Usage Patterns
Another common issue organizations face is tracking data throughout its lifecycle. Whether data is purchased via subscriptions or generated from internal activities, data needs to be tracked as it is utilized, manipulated, and transformed throughout the organization. Data managers need to evaluate the demand for particular data to gauge its value or to ensure quality standards are being followed. Data users may want to know who else is working on the same data or want to trace how the data they use has been derived or manipulated from previous versions. These two needs of data managers and users are the reasons why data governance plans require the tracking of:
- Ownership – Who produced or acquired the data and who is responsible for it in its current form.
- Lineage – How the data changes over time and what manipulations were applied to source data to result in its derived forms.
- Analytics – Who the users are for the data and how much demand it has at the organization.
Identifying Duplicated or Obsolete Data
Duplication of data and information causes many problems for organizations. Duplicate data means, at best, acquisition or storage costs are being duplicated. At worst, duplicate data means rework happens, only to achieve the same goals. As a result of data processes at the organization, whole datasets can be duplicated, and specific elements, columns, or records will be copied across different resources. Identifying when data has been duplicated is a major challenge for effective data governance. The key to solving this problem is the enrichment of data with descriptive and semantic information. The proper tracking of lineage and ownership will also address this issue by helping data users to relate data elements across data sets and data sources. We find that organizations benefit from better describing and relating data elements. An improved awareness of relevant data gives users the opportunity to analyze their data with new perspectives by uncovering the interconnectedness between data elements at the organization.
Obsolete data is data that is minimally used or has been replaced by other data resources. Like duplicate data, obsolete data can increase data clutter. More storage infrastructure will be needed to maintain this data. A greater potential cost is users may accidentally use the obsolete data instead of a newer resource. Organizations can identify obsolete data when all data elements are tracked and related to each other and obtain a clear view of how to address the problem. Outdated data may have value for archival purposes, for example, whereas other data may truly be obsolete and can be removed.
Increasing Buy-In from Leadership
Major changes to data management policies will need support from key stakeholders and leadership. As discussed above, data governance provides persuasive evidence for making data management decisions. Above all, data governance reduces data management bureaucracy in the following ways:
 Inefficient or ineffective resources are promptly noticed and addressed,
- Managers are more effective at overseeing a larger amount of data,
- Easy to identify who has input and when for changes to data management practices, and
- Less face-to-face time for committees and meetings will be needed to coordinate data use.
Further, data governance focuses on increasing the value of data management processes and reducing risks. Good data governance will provide information on the value of data assets for the organization. As a result, it will be easier to produce cost analyses or return on investment analyses as needed. This benefit will lead to improved planning of data management initiatives. Data governance activities also provide great opportunities to define job-related performance metrics to make the evaluation of data management relevant to a greater number of roles.
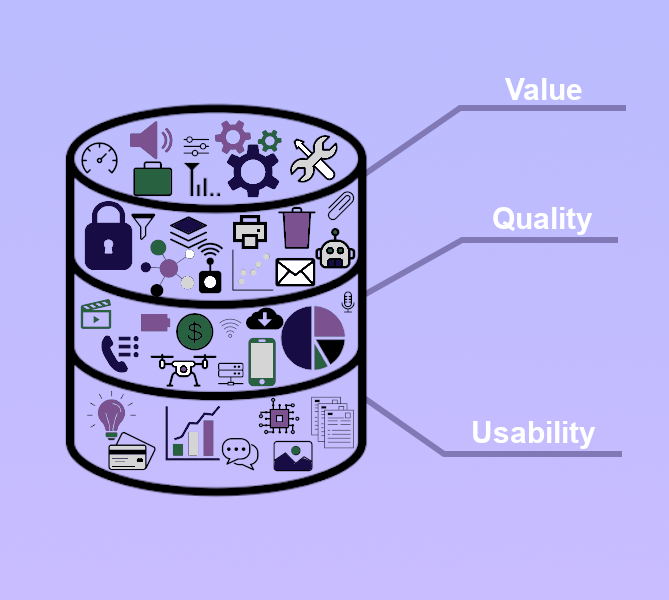
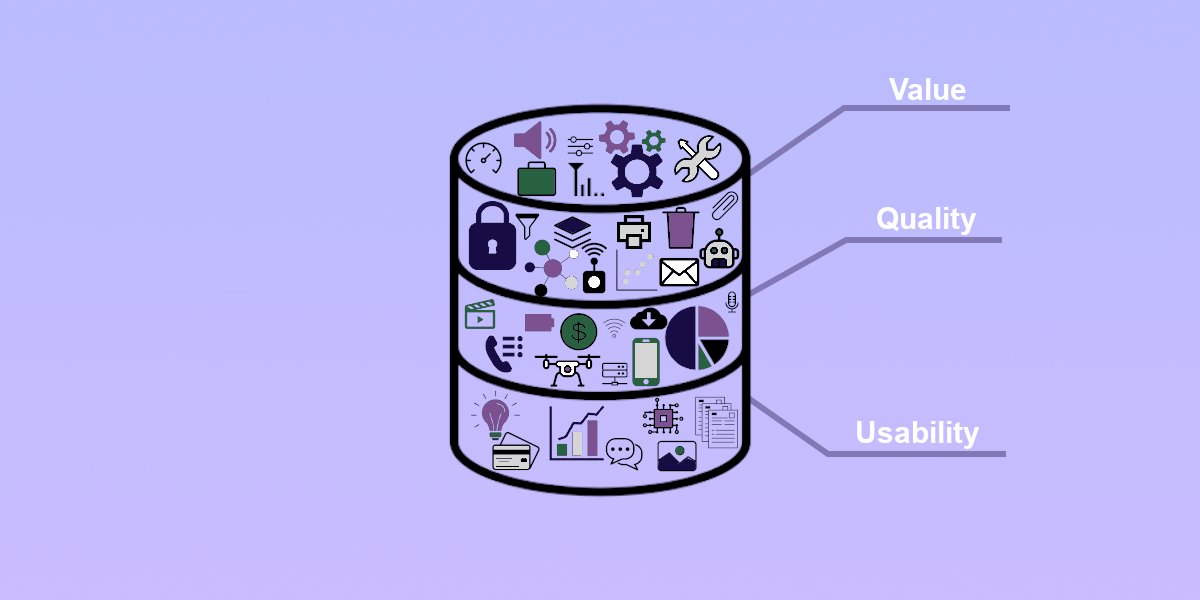
These examples of why data governance matters reveal a clear theme of managers and data users needing to have well-organized and described data. Data that is easy to understand and connected across the organization is ideal for data governance activities, and requires a scalable framework and model that can make the business case, while garnering support from across the organization. How is it possible to put this model in place as a useful component of an organization’s information architecture?
The Knowledge Graph Data Governance Framework
It may seem like a daunting task to construct a resource that can speak to all these different concerns. A specialized data model, or ontology, can easily and effectively handle mapping problems just like those explored above. A specific type of ontology, called a knowledge graph, can capture the organization’s concerns when it comes to data governance in a flexible and intuitive model.
Knowledge Graphs as a Semantic Layer
Data does not explain itself nor its journey. Yet, data is only valuable in the context of what it means to end users. Thus, data must be described and organized to capture this meaning. Each data element should be situated in context with the tables, systems, and use cases it is involved in. Data elements should also have clear definitions as a majority of data users need to understand the associated meaning and opportunities for generating value.
These are simple rules, yet many organizations are lacking this key information. Often, data is generated by experts who do not rely on such descriptions. Without good data governance, the data remains undescribed. If the data is used by other users or is centralized to a data warehouse, the lack of context becomes a major problem. It causes slow downs to any process that needs the information in the data. Developers and analysts have to devote extra time to making sense of the data for their use. If the data is still not better organized at this point, these slow downs repeat over and over. These compounding inefficiencies can be avoided by describing data from the start.
Knowledge graphs are an excellent way to model metadata, or “data about data” that typically includes descriptive information. Knowledge graphs involve entities, attributes, and their relationships, and these three components allow for the modeling of rich descriptive meaning of data elements. Common metadata, such as names and definitions, can be modeled as attributes of data elements. Relationships allow data elements to be directly related to other types of information. For example, a single data element, such as a variable that tracks average home prices, can be related to other data elements that are similar, such as a variable that tracks the median home price. A variable tracking average home prices may be similar to one tracking median home prices because they both are measures of center for the same data type. They can also be related to other versions or to data owners. The key is that the knowledge graph has the flexibility to model whatever meaning and context is useful for users.
The combination of detailed metadata and relationships results in a semantic data layer. A semantic data layer is a resource that fully describes the meaning of data and makes data easier to understand. Thus, both experts and unfamiliar users can take advantage of any data asset to which they have access.
Knowledge Graphs for Domain Mapping
For most organizations, an integrated view of data requires deliberate data organization from a top-down perspective. Although it is common for the organization of a company’s data to develop over time in an ad hoc, bottom-up fashion as various divisions generate and acquire data, these differences lead to data with inconsistent quality and usefulness to the organization as a whole.
Data management leaders must focus on data organization at an enterprise level. This does not necessarily mean that the priority should be a centralized data infrastructure (e.g. warehouses and data lakes), as this move is often executed without building an accompanying data layer to help make the data, as a whole, more meaningful and valuable. 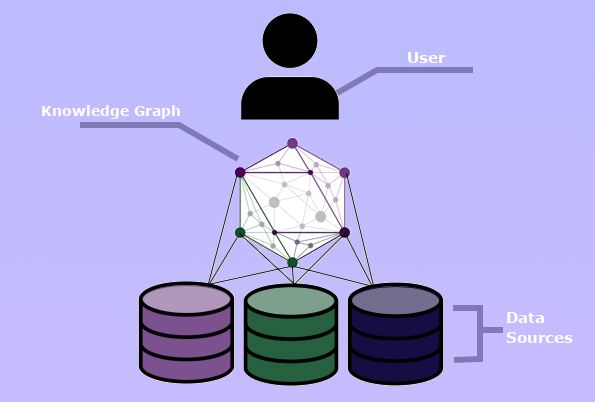 Ultimately, this means that the data should be organized, structured, and assessed from an enterprise-wide user perspective, aligning the physical data across the organization with the conceptual understanding of data users. It is much easier for data users to look for information using their everyday language. The knowledge graph allows for this to happen by providing an abstraction layer in the organization’s data architecture that is a model of the enterprise information domain. This layer enables information managers to actively define the domain with key users’ perspectives in mind. The graph maps to both the physical data, as well as a common conceptual model, that is shared by users at the organization.
Another common way of describing this process is via the 360-degree view. Many organizations, for example, want the “360-degree view” of their customers, products, services, etc. This is the same idea underlying domain modeling. Data managers and ontologists determine what data the organization has as a whole about its customers. A knowledge graph is the combination of 360-degree views for all major entity types. An entity type is a unique type of thing that enterprise data is describing. For instance, people, customers, suppliers, and publications could all be entity types at an organization. The knowledge graph also includes the key relationships between unique entity types. These relationships generate value by interconnecting 360-degree views for different entities.
 When designing the knowledge graph, the data manager or ontologist aligns data sources and elements with unique domain entities. The relationship between the physical data and the domain model allows data users to access data by referring to concepts in the model. The knowledge graph layer becomes a functional “one-stop-shop” for accessing data. This type of integration is also useful for application developers. Developers use the model to work from a conceptual understanding of user needs to then call data from the correct sources.
Knowledge Graphs for Tracking Lineage and Ownership
Good data governance requires tracking data through its lifecycle at the organization, where it is being stored, consumed, and consciously optimized.
Knowledge Graph structures also provide the flexibility to model changes in data over time and thus help with data lineage. As data elements change, the graph can be updated to reflect the status of that element over time. This leads to a traceable change history with key metadata to describe the changes for each data element while providing the ability to conduct change impact assessments. With data elements closely interrelated to each other, it will be easy to predict the effects of modifying specific elements.
Tracking data ownership is also possible with knowledge graphs. Ownership can be represented by an ownership relationship between the data elements and the employee. In this way, the graph links data to data owners, so users and data managers can quickly identify ownership. The owners will also have their own metadata in the graph, making it easy to contact or locate them for help.
Knowledge Graphs for Improving Data Quality
Another feature of knowledge graphs is to allow the analysis of network effects. Network effects are the interactions between entities and their properties across the graph. One use case for network effects is recommendation engines, helping users discover related and relevant content that would have otherwise gone unnoticed. Similar data elements can be located by their unique sets of properties and relationships.
Network effects can also be used to increase data quality. For example, patterns across the graph can be harnessed to identify duplicated information. Duplicated data will have shared connections with other entities. This overlap in relationships can serve as a red flag for managers to investigate possible data duplication or opportunities for data integration. If user analytics are also tracked at the organization, the patterns between users and data can be modeled and assessed. Knowledge of users’ patterns, when combined with the graph, can help predict which data is well-utilized and up-to-date or obsolete. Along with data lineage and ownership tracking, network analysis in the knowledge graph is a major tool for ensuring data quality.
Best Practices for Getting Started
The knowledge graph serves as the crucial map that an organization needs to achieve effective data governance. To begin optimizing data governance, the number one priority is to develop a lean data governance strategy that derives meaning and value out of data for the enterprise. We partner with our clients to optimize their data governance strategy to include EK’s recommended key principles underlying effective data management. These principles guide the analysis of what information is currently being tracked and how well the organization is monitoring data management. We work with clients to develop knowledge graphs for the purposes outlined in this article to ensure the data governance plan is implemented successfully and with the greatest impact to the organization. Contact us for more information on how our data governance and knowledge graph solutions can benefit your organization.