
The explosion of data and data scientists is making data governance more important, and more difficult. Most large organizations have thousands of data files and a wide range of users working with those files. The size and complexity of these data sets makes old school data dictionaries and Entity Relationship Diagrams (ERD) useless. We are helping our clients solve this problem through Knowledge Graphs that capture the data they have, how different data sets are related, how the data is being used, and what changes are being made to data. These semantic tools are changing the way in which our customers manage their Business Intelligence (BI) infrastructure. The best way to explain how these Knowledge Graphs work is through use cases. Below, I have included two different examples.
Before sharing these use cases, it is important to understand how a data governance knowledge graph works. Knowledge graphs are built using ontologies and graph databases. An ontology is a model describing entities in the form of people, places or things, and how they relate to one another. For this use case, we are talking about three different entities.
- The person – The analyst or data scientist working with the data sets.
- The data set – The table or file that is being analyzed.
- The data element – A specific piece of data within a data set.
These entities are related to one another. A person works with a data set. A data element is part of a data set and is related to another data element. This information is stored in a graph database (A.K.A. triple store) so that these relationships can be tracked and queried as part of a data governance application. Still uncertain about what a Knowledge Graph is? Check out my colleague’s blog: What is an Enterprise Knowledge Graph and Why Do I Want One?
Our first example is a large government agency with over 12,000 data sets that are queried and processed by hundreds of different data scientists. The organization had previously built a data dictionary to help their data scientists find the data sets they needed, as well as create a single platform for storing and managing most of their data sets. Even with those tools in place, the data scientists were unable to understand the data they had access to and determine if it was reliable. Further, the data dictionary was too high level and often incomplete. While the data platform allowed for better control of the data, changes to the data were not tracked and there was little collaboration between the data scientists.
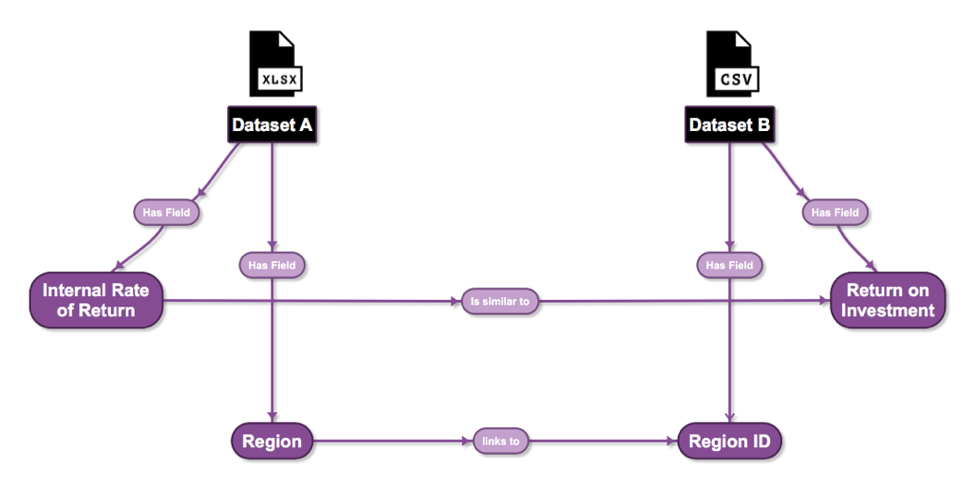
To help alleviate frustrations felt by the agency’s data scientists, we are developing a knowledge graph that captures all of the data sets, their data elements, and how they relate to one another (see image below).
To-date, we have created a search application to allow the data scientists to find data sets and traverse between data sets based on the relationships between the data elements. This same solution will also control who can see data sets and how each data set has changed (a data change log). The client now has an application that allows them to traverse a very complicated domain that includes a series of forms and the institutions that they work with. For the first time, they are able to see their data without the limits of the data sets that they used to work with.
Our second customer was looking to simplify the way that they query their Business Intelligence (BI) systems. They wanted to create a natural language query capability that would allow their users to ask simple questions (through search queries or a chatbot) and have the system respond with charts and graphs that answer the questions. This governance use case is less about control and more about simplification of a very complex data model. The current data lake is built on SAP Hana. Simple questions required multi-table joins where the SQL is no less than 8-10 lines long. Business users were unable to get answers to simple questions without having to request the help of a very senior IT person to develop queries and reports.
Our consultants took the existing tables and queries and developed an ontology that aligned with the business questions. Ontologies define people, places, and things, and how they are related to one another, so they are better aligned with the way that people ask questions about their data. We then mapped the relational tables (and their associated queries) to the ontology. This mapping is called a virtual graph and is supported in a number of graph database tools.
Once the knowledge graph is complete, we plan to provide a simple search interface and a chatbot so that business users can ask critical questions and get back answers in the form of charts, graphs, and reports. This new approach will simplify the data model and give the business access the information they need to make decisions.
Knowledge graphs are most often thought of as tools that work with search and unstructured content. We are finding that they are excellent tools for controlling data and empowering people in complex data environments as well.
Interested in learning more about how your organization can use knowledge graphs to tame your data problem? Read more or email us at info@enterprise-knowledge.com to learn more about these powerful tools.