
When managing websites or performing an analysis on a website, as important as it is to know where your visitors are coming from, what pages they are viewing, and other aspects of interaction; it is equally important to know how well your web server is performing in offering up the content that your organization has worked so hard to gather and make available to visitors.
Within Google Analytics, you can get a glimpse of your website and server performance in the “Behavior → Site Speed” section of the “Reports” Menu. The Site Speed report is always generated from sampled data and, by default, the sample size is fixed at 1% of your visitors. Site Speed can also only be tracked for visitors who use a browser that supports HTML5 Navigation Timing (i.e. Chrome, Firefox 7 and above, Internet Explorer 9 and above [earlier versions of IE if the Google Toolbar is installed], Edge, some versions of Safari, Android 4.0 and above, additional browsers also support this feature but are used less frequently.)
The single most important System Performance Metric on the Site Speed page for a website is the Average Page Load Time. Average Page Load Time is derived from combining seven separate measures (Redirection Time, Domain Lookup Time, Server Connection Time, Server Response Time, Document Interactive Time, Document Content Load Time, and Page Download Time) into a single metric. It should be noted that the Average Page Load Time benchmark for a typical data-driven website in 2016 and 2017 was 3 seconds. Due to the faster computer hardware and internet connections that have become available since 2017, it would not be unreasonable for visitors to expect page load time of 2 seconds or less by today’s standards.
The following is an explanation of Average Page Load Time:
Average Page Load Time (The target range for this measure should be 2 seconds or less.) – Average Page Load time is the average time measured in seconds it takes for a page to fully load based upon the sample data set and the date range selected.
Average Page Load Time starts when the navigation process begins (i.e., the visitor clicks on a link either internally on a page of your site or externally contained on another website which is linking to your website) and ends when the webpage has completely finished loading in their browser. This measure incorporates all the measures below (items 1 – 7) and as such will always be the largest time based metric when measuring a system’s performance.
Once a potential visitor clicks on a link that will take them to your website, Google Analytics starts tracking seven specific metrics that measure system performance. The following is the order in which these measurements occur or the timeline in which Google measures metrics associated with system performance and determines the Average Page Load Time.
- Average Redirection Time (The target range for this measure should be between 0 and 0.30 seconds.) – Redirects should be avoided but sometimes they are inevitable and if redirects are involved this will indicate the time it takes for a redirect to start and end, if no redirects are involved this metric will show zero (0.
- Average Domain Lookup Time (Target range for this measure is between 0.01 and 0.03 seconds.) – Google defines this as “the average amount of time (in seconds) spent in DNS lookup for this page.” This measures how long the user’s browser searches for your website’s IP address. At this point in the timeline, no data from your website has started to load and a common factor that can affect this measurement is content being rendered from multiple locations (i.e., Third party scripts.) This should be one of the shortest time measurements associated with the page load timing sequence.
- Average Server Connection Time (Target range for this measure is between 0.01 and 0.25 seconds.) – Google defines this as “the average amount of time (in seconds) spent in establishing a TCP connection for this page.” This timer starts immediately after the domain lookup is complete and measures the amount of time it takes for the server to connect with your visitor’s device. This measure, much like Average Domain Lookup Time, should also be one of the two fastest times in the timeline for a page to load.
- Average Server Response Time (ART) (The target range for this measure should be 0.20 seconds (200ms) or less.) – Google defines this as “the average amount of time (in seconds) your server takes to respond to a user request, including the network time from user’s location to your server.” This metric can be affected by any or all of the following: slow application logic, slow database queries, slow routing, and resources issues such as CPU starvation, memory starvation, even the visitor’s location and network architecture.
- Average Document Interactive Time (Target range for this measure is less than 0.80 seconds.) – This measurement starts when actual page content begins to load into the visitor’s browser. During the document interactive time, the page is still loading but enough content is loaded that the visitor can begin to engage with the page. The user can likely see text, click on a hyperlink, and see an image or two. This metric measures the amount of time in seconds it takes to get to this point in the timeline from the initiation of the timeline (items 1 – 4 above.) While content is not fully loaded, it is at this point that most visitors will perceive that a page either loads fast or slow.
- Average Document Content Loaded Time (Target range for this measure should be less than 1.0 second.) – Google defines this metric as “the average time (in seconds) that the browser takes to parse the document and execute deferred and parser-inserted scripts (Document Object Model (DOM) Content Loaded), including the network time from the user’s location to your server.” This measure takes into account the entire timeline up to this point (items 1 – 5) and as such it should always be higher than the Average Document Interactive Time.
- Average Page Download Time (The target range for this measure is 1.0 second or less.) – Google defines this measurement as “the average amount of time (in seconds) to download this page.” At this point, the web page has finished loading but other aspects such as CSS, images, and any other items referenced have not fully loaded, this measurement quits counting once all content has loaded. This measure does not include any other measures up to this point, only the time for the entire web page content to be loaded to completion.
By measuring and monitoring all seven of Google Analytics’ site performance measures, a more comprehensive picture of the system’s performance can be analyzed allowing the website owner or analyst to identify any performance bottlenecks. Performance bottlenecks can be broken down into two broad categories: pre-page load measures and page loading measures. Pre-page load bottlenecks can be determined by an analysis of measurements 1 – 4 above and may be outside the scope of the website owner’s control; page loading bottlenecks can be determined by an analysis of measurements 5 – 7 above and the website owner in all cases can control the factors making up these measurements.
The measurements of the seven site performance metrics are combined to yield the Average Page Load Time. The target range for the process of offering up a web page is two seconds or less from the start of navigation (item 1) to the page being completely loaded (item 7.)
Please see Figure 1 below for a graphical representation of the Average Page Load Time, Average Document Content Loaded Time and Average Document Interactive Time.
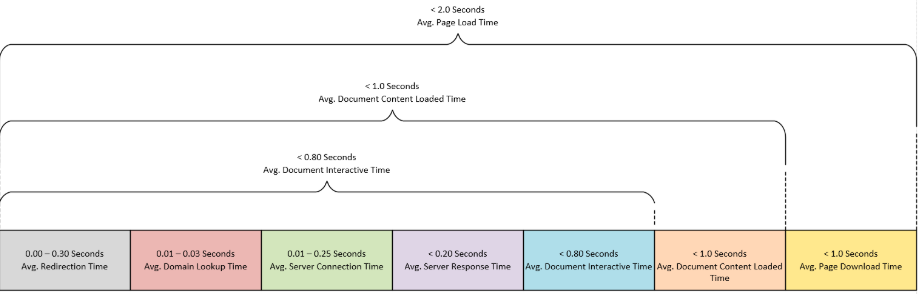
Figure 1: Google Analytics Average Page Load Time Line
Before making any adjustments to your server, having your web developer overhaul your website, or calling your service provider and demanding a bigger pipeline to your website, keep in mind that these are targets and many factors can affect these numbers (See Figure 2 below.) Items such as the visitor’s browser or even the version of their browser, their geographical location, or their network can cause these numbers to inflate. Do some analysis and filtering: look at different time periods, filter out known slow locations, see which networks are slowest, look at the percentage of visitors using a particular browser, and compare the speeds for different pages (a single slow often viewed page could be the cause.) A tiny portion of bad traffic outside your control could also be causing your numbers to inflate. This is sampled data and only represents a small portion of all traffic to your website. Therefore, see how fast your website loads for you, and if you find it acceptable then probably most visitors will as well.
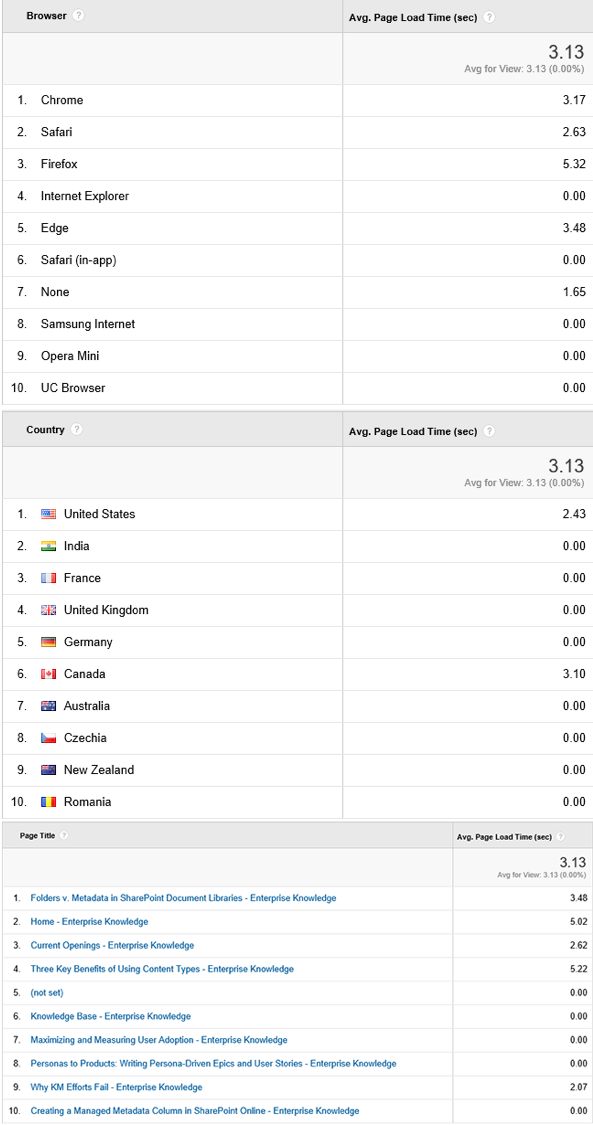
Figure 2: Variances in Page load Time based on Browser, Country, and Page
Sources:
- https://support.google.com/analytics/answer/1205784?hl=en
- https://support.google.com/analytics/answer/2383341?hl=en
- https://www.lunametrics.com/blog/2015/09/09/guide-to-google-analytics-site-speed-metrics/
- https://en.wikipedia.org/wiki/Document_Object_Model
Definitions:
DOM or Document Object Model – is a cross-platform and language-independent application programming interface that treats an HTML, XHTML, or XML document as a tree structure wherein each node is an object representing a part of the document. The objects can be manipulated programmatically and any visible changes occurring, as a result, may then be reflected in the display of the document.