
Introduction
After the Harvard Business Review called Data Scientist the sexiest job of the 21st century in 2012, much attention went into the interdisciplinary field of data science. Students and professionals were curious to know more about what data scientists do, while businesses and organizations across industries wanted to understand how data scientists could bring them value.
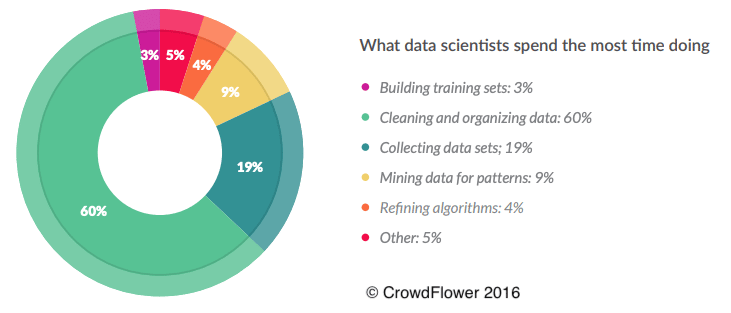
In 2016, CrowdFlower, now Appen, published their Data Scientist report to respond to this newfound interest. This report aimed to survey professional data scientists with different years of experience and fields of expertise to find, among other things, what their everyday tasks were. The most important takeaway from this report is that it supports the famous 80/20 rule of data science. This rule states that data scientists spend around 80% of their time sourcing and cleaning data. And, only 20% of their time is left to perform analysis and develop machine learning models, which according to the same CrowdFlower survey, is the task that data scientists enjoy the most. The pie chart below shows that 1 out of every 5 data scientists spends most time collecting data, while 3 out of every 5 spend most of their time cleaning and organizing it.
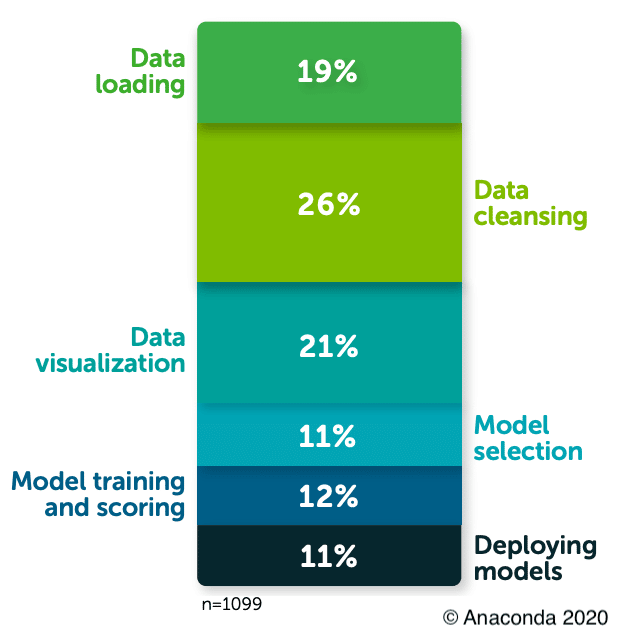 More recently, Anaconda’s 2020 State of Data Science Report shows that the time data scientists spent collecting, cleaning, and organizing data improved. It now takes up to 50% of their time. From the bar chart on the right, we can notice that most of the improvement is due to a dramatic decrease in the time spent cleaning data, from 60% in 2016 to 26%. However, collecting data remained static at 19%. We can also notice the introduction of time spent on data visualizations. This addition speaks to the growing need to communicate the value of the data scientist’s work to non-technical executives and stakeholders. And therefore, it is not surprising that the amount of time dedicated to developing those visualizations is a third of the time spent generating that value through model selection, model training and scoring, and deploying models.
In my experience, Anaconda’s report remains true to this date. When starting a data science project, finding the relevant data to fit the client’s use case is time-consuming. It often involves not only querying databases but also interviewing data consumers and producers that may point to data silos only known to a small group or even bring out discrepancies in understanding among teams regarding the data. Bridging the gap in understanding data among data personas is the most time-consuming task and one that I have witnessed data catalogs excel at performing.
To keep this trend and reverse the 80/20 rule, businesses and organizations must adopt tools that facilitate the tasks throughout the data science processes, especially in data sourcing and cleaning. Implementing an enterprise data catalog would be an ideal solution with an active role throughout the data science process. By doing so, data scientists will have more time to spend on high-value-generating tasks, increasing the return on investment.
Enterprise Data Catalogs
Data catalogs are a metadata management system for the organization’s data resources. In the context of this blog, they help data scientists and analysts find the data they need and provide information to evaluate its suitability for the intended use. Some capabilities enabled by a data catalog are:
- Increased search speed utilizing a comprehensive index of all included data
- Improved visibility with custom views of your data organized by defined criteria
- Contextual insights from analytics dashboards and statistical metrics
- Documentation of cross-system relationships between data at an enterprise level
Because of these capabilities, data catalogs prove to be relevant throughout the data science process. To demonstrate this, let’s review its relevance through each step in the OSEMN framework.
Value of Data Catalogs to the OSEMN Framework
The acronym OSEMN stands for Obtaining, Scrubbing, Exploring, Modeling, and iNterpreting data. It is a convenient framework to analyze the value of data catalogs because each step translates to a specific task in a typical data science project. Mason and Wiggins introduced this five-step OSEMN framework in their article “A Taxonomy of Data Science” in 2010, and it has been widely adopted by data scientists since.
Obtain
This step involves searching for and sourcing relevant data for the project. That is easy enough to do if you know what specific datasets to look for and whom to ask for access to the data. However, in practice, this is rarely the case. In my experience, the projects that generate the most significant value for the organization require integrating data across systems, teams, departments, and geographies. Furthermore, teams leading analytics and data science efforts recognize that the ROI of the project is highly dependent on the quality, integrity, and relevance of the sourced data. They, therefore, have been spending about a fifth of their time sourcing and verifying that they have high-quality and complete data for their projects. Data catalogs can help reduce this time through advanced search, enhanced discoverability, and data trustworthiness.
- Advanced Search: Enterprise-wide faceted search provides knowledge instead of simple results by displaying the data’s contextual information, such as the data assets owner, steward, approved uses, content, and quality indicators. Most teams won’t have access to all of the enterprise datasets. However, these metadata profiles help data scientists save time by using this information to find what data is available to them quickly, assess their fitness for their use case, and whom to ask for access to the data they need.
- Enhanced Discoverability: Although this is the first step in the OSEMN framework, this step comes after understanding the business problem. This understanding gives greater insight into the entities involved, such as customers, orders, transactions, organizations, and metrics. Hence, users can tag datasets according to the entities present in the data, and the data catalog can then auto-tag new content as it gets ingested. This feature allows new data to be discoverable almost immediately, resulting in additional and more recent data available for the project.
- Data Trustworthiness: Searching for data across systems and departments can be time-consuming and often does not yield great results. Occasionally, you might stumble upon data that seems fit for your use case, but can you trust it? Because of data catalogs, data scientists can save time by not having to do detective work tracking down the data’s origins to assess its reliability. Data catalogs allow you to trace the data’s lineage and display quality metrics taking out the guesswork of sourcing your data.
Scrub
Data scientists would curate a clean data set for their project in this step. Some tasks include merging data from different sources into a single data set, standardizing column formatting, and imputing missing values. As examined in the introduction, the time spent cleaning and organizing data has sharply decreased. I believe the advent of user-friendly ETL solutions has played a significant role in bringing down the time spent in this step. These solutions allow users to define pipelines and actions in graphic interfaces that handle data merging, standardization, and cleaning. While some data catalogs have such comprehensive ETL features, most will have basic ETL capabilities. The users can then expand these basic capabilities through third-party integrations. But ETL capabilities aside, data catalogs are still helpful in this step.
Many organizations reuse the same data assets for multiple initiatives. However, each team cleans and standardizes the data only to store it inside their own project folder. These data silos add clutter, waste storage, and increase duplicative work. Why not catalog the clean and standardized data? This way, the next team that needs to use the data will save time using the already vetted and cleaned data set.
Explore
Data scientists usually perform exploratory data analysis (EDA) in this step. EDA entails examining the data to understand its underlying structure and looking for patterns and trends. Some of the queries developed in this step provide descriptive statistics, visualizations, and correlation reports, and some may even result in new features. Data catalogs can support federated queries so that data scientists can perform their EDA from a single self-service store. This way, they save time by not having to query multiple systems at different access points and figuring out how to aggregate them in a single repository. But the benefits do not stop there. The queries, the aggregated data set, and visualizations developed during the EDA process can also be cataloged and discoverable by other teams that might reuse the content for their initiatives. Furthermore, these cataloged assets become fundamental for future reproductions of the model.
Model
 According to the CrowdFlower survey, this is the most enjoyable task for data scientists. We have been building up to this step, which many data scientists would say is “where the magic happens.” But “magic” does not necessarily have to be a black box. Data catalogs can help enhance the models’ explainability with their traceability features. Due to this, every stakeholder with access to the information will be able to see the training and test data, its origin, any documented transformations, and EDA. This information is an excellent foundation for non-technical stakeholders to understand and have enough context for the model’s results.
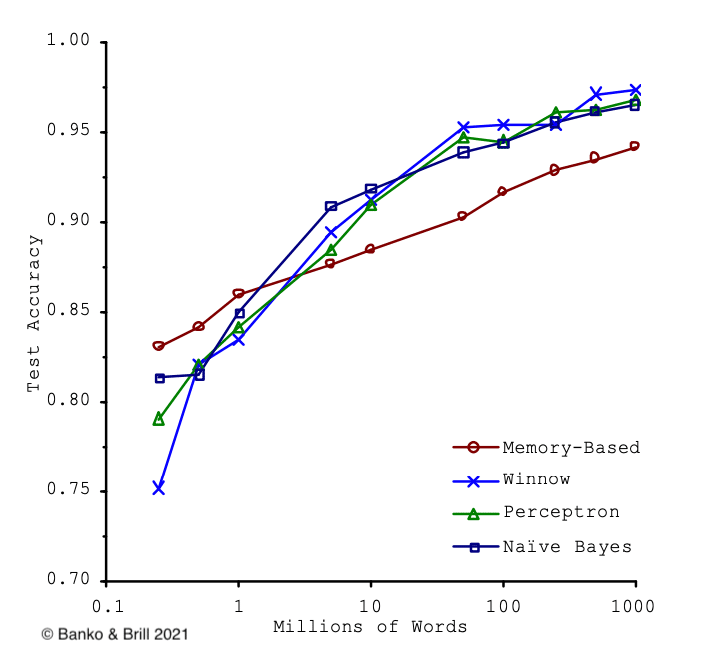
So far, data catalogs provide circumstantial help in this phase, primarily byproducts of the interactions between the data scientist and the data catalog in the previous steps. However, data catalogs are directly beneficial during the model selection process. As we can see from the chart on the right, as more training data become available, the results of separate models become more similar. In other words, the model selection loses relevancy when the training data available for the model to train on increases. Hence, a data catalog provides a data scientist with a self-service data discovery platform to source more data than was feasible in previous efforts. And therefore, it makes the data scientists’ task more efficient by removing the constraints on model selection caused by insufficient data. Moreover, it saves time and resources since now data scientists can train fewer models without significantly impacting the results, which is paramount, especially when developing proof-of-concept models.
iNterpret
This step is where data scientists communicate their findings and the ROI of the project to the stakeholders. In my experience, this is the most challenging step. In Anaconda’s report, data scientists responded on how effectively their teams demonstrated the impact and value of data science on business outcomes. As we notice from the results below, data science teams were more effective in communicating their impact on businesses in industries with a higher proportion of technical staff. We can also notice a wide efficiency gap across sectors, with teams in consulting and technology firms having almost twice the efficiency in conveying their projects’ impact as teams driving healthcare data science projects.

To accommodate non-technical audiences, many data scientists facilitate this demanding task using dashboards and visualizations. These visuals improve the communication of value from the teams to the stakeholders. Further, data scientists could catalog these dashboards and visualizations in the metadata management solution. In this way, data catalogs can increase the project’s visibility by storing these interpretations in the form of insights that can be discoverable by the stakeholders and a wider approved audience. Data scientists in other departments, geographies, or subsidiaries with a similar project in mind can benefit from the previous work done and build on top of that whenever possible. Therefore, reducing duplicative work.
Conclusion
Data catalogs offer many benefits throughout a data science project’s process. They provide data scientists with self-service data access and a discoverability ecosystem on which to obtain, process, aggregate, and document the data resources they need to develop a successful project. Most of the benefits are front-loaded in the first step of the OSEMN framework, obtaining data. However, we can note their relevance throughout the remaining steps.
I would like to clarify that no single data catalog solution will have all the capabilities discussed in this article embedded as a core feature. Please consider your enterprise needs and evaluate them against the features of the data catalog solution you consider implementing. Our team of metadata management professionals has led over 40 successful data catalog implementations with most major solution providers. Don’t hesitate to contact us so we can help you navigate the available data catalog solutions and use our expert knowledge to choose the one that best fits your organization’s needs and lead its successful implementation.
Resources and Further Reading
- How Data Scientists Find Relevant Data with a Data Knowledge Graph (EK Team, 2018)
- A Data Scientist Perspective on Knowledge Graphs (Part 1): the Data-Driven Challenge (Van Rossom, 2022)
- Scaling to Very Very Large Corpora for Natural Language Disambiguation (Banko & Brill, ACL 2001)
- State of Data Science 2020 (Anaconda, 2020)
- Data Science Report 2016 (CrowdFlower, 2016)