
Enterprise knowledge graphs are one of the fastest growing trends in knowledge management. Their intuitive and flexible structure, combined with their emphasis on relationships between entities, make knowledge graphs a natural fit for use cases that require aggregating content from multiple disconnected systems. For example, many organizations are beginning to use knowledge graphs to establish a “360 degree view” of assets, service levels, issue resolution, and customer experiences to get a full picture of business critical operations. One area where knowledge graphs are quickly adding value is the use of digital twins to model real world assets, such as buildings and equipment. These digital twins enable organizations to visualize, understand, and analyze information about assets across multiple data sources, improving efficiency and decision making across systems.
What’s a Digital Twin?
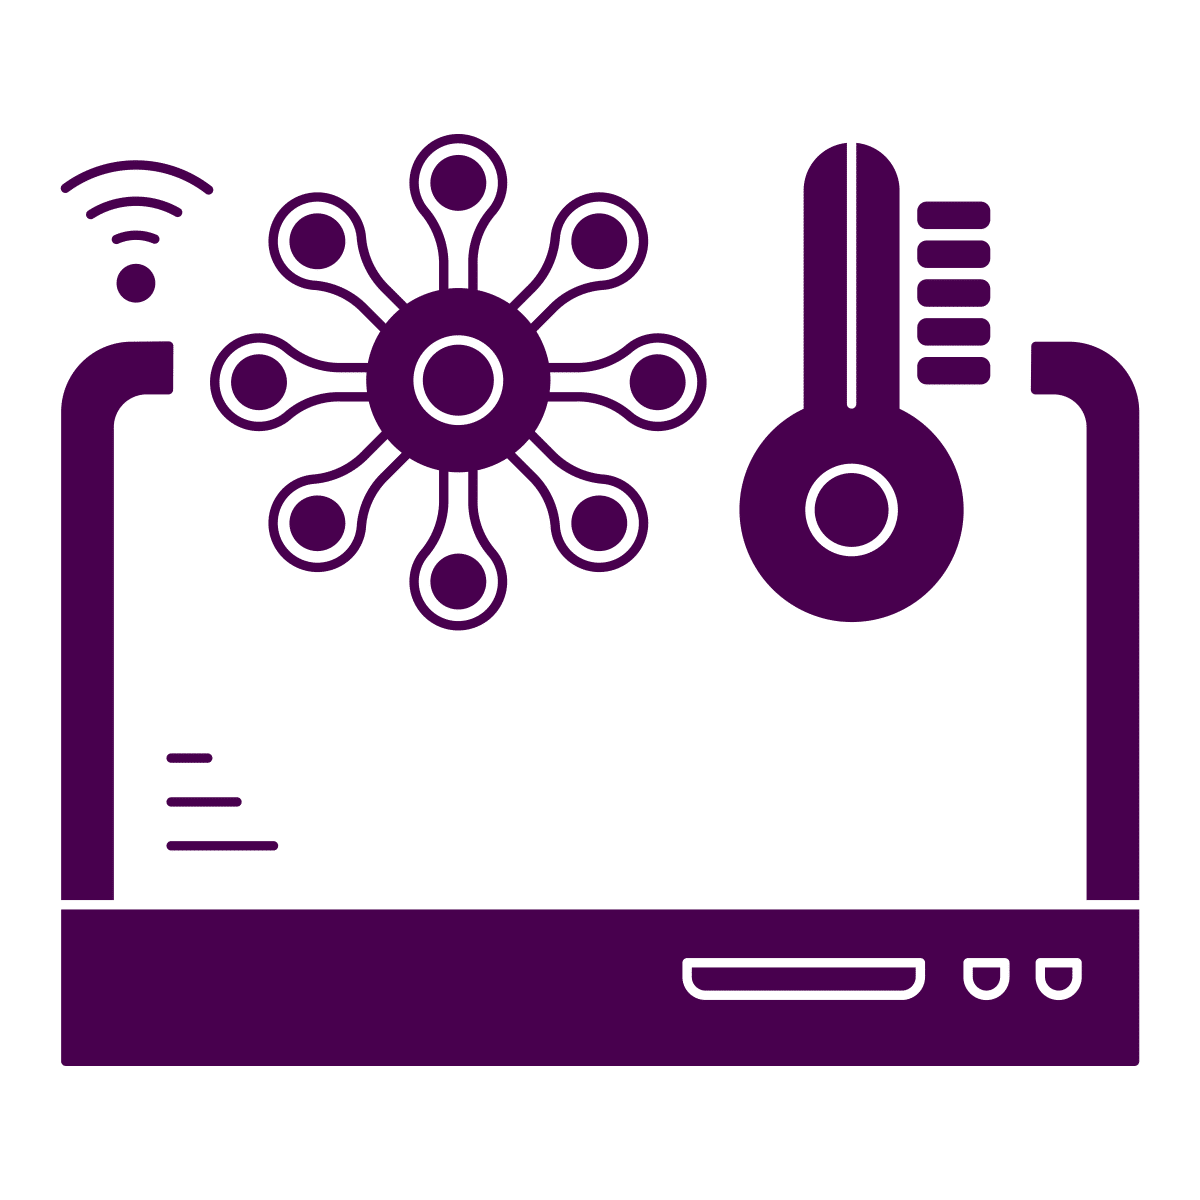
A digital twin is a digital representation of a real world object using structured, machine readable data. They can be used to gain a better understanding of complex entities with high quantities of real time data or components, and are often used in asset based industries like manufacturing, utilities, real estate, defense, automotive and aerospace engineering, information technology, and networking communications. A crucial component of the industrial internet of things (IIoT), digital twins leverage the real time data generated by sensors and monitoring systems, combining this with other information about an asset, such as maintenance data, service management data, and even third party data such as weather conditions. This creates a rich representation of not only individual assets, but their relationships and dependencies, giving you a 360 degree view of your entire system and inventory.
These digital representations of real world objects can be used to meet a variety of needs for organizations with complex networks of assets, including:
Fault detection
Many fault detection systems generate too many false positives, leading to alarm  fatigue that can limit the response to real issues. Digital twins can be used to find real faults based on real data. For example, buildings often leverage sensor data to identify system outages that may impact building tenants, such as issues with plumbing or electrical systems. Faulty sensors can cause erroneous outage notifications alarms which result in technicians responding onsite to remediate an issue that doesn’t actually exist. Using digital twins, sensor data can be cross referenced against data from multiple sources to determine whether or not the sensor data is accurate. This reduces false positive alarms and identifies faulty sensors, allowing organizations to optimize the assignment of scarce maintenance resources.
Predictive maintenance
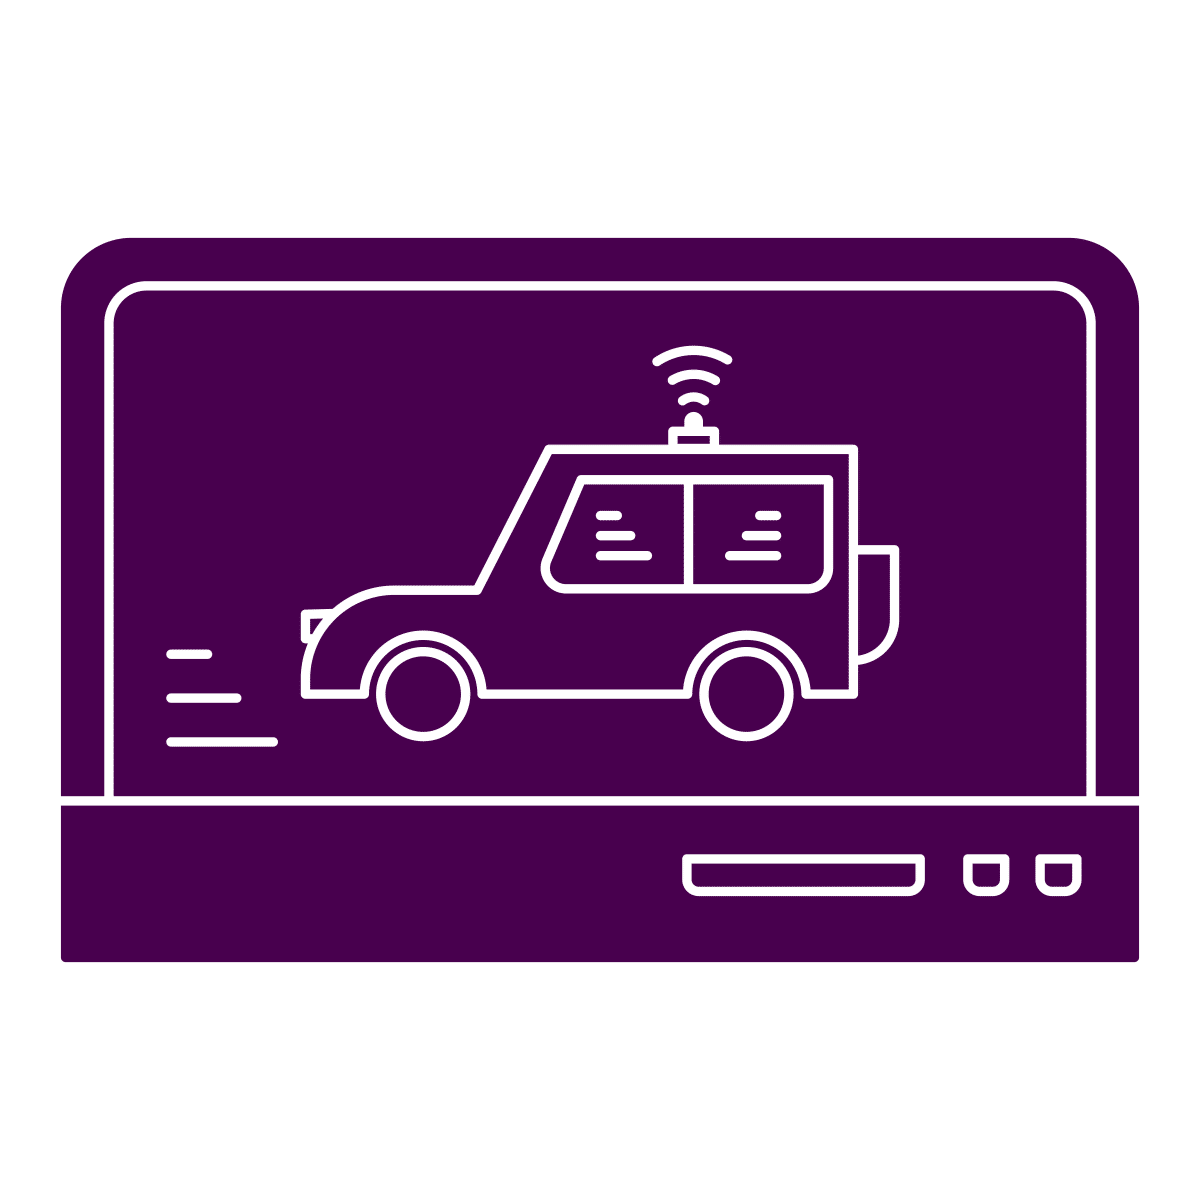 Using digital twins, you can combine information about an asset’s current condition with its maintenance history, allowing you to efficiently target assets due for maintenance and achieve condition-based maintenance or reliability-centered maintenance goals. For example, digital twins of automotive fleets can be used to ensure that each vehicle is optimally maintained, given that vehicle’s maintenance history, mileage, the weather conditions in which it’s been operating, and real time sensor data from each of its components.
Improved resiliency
Having a 360 view of your systems can help you identify weak points, quickly repair issues, and even use predictive algorithms to prevent failures from occurring in the first place. 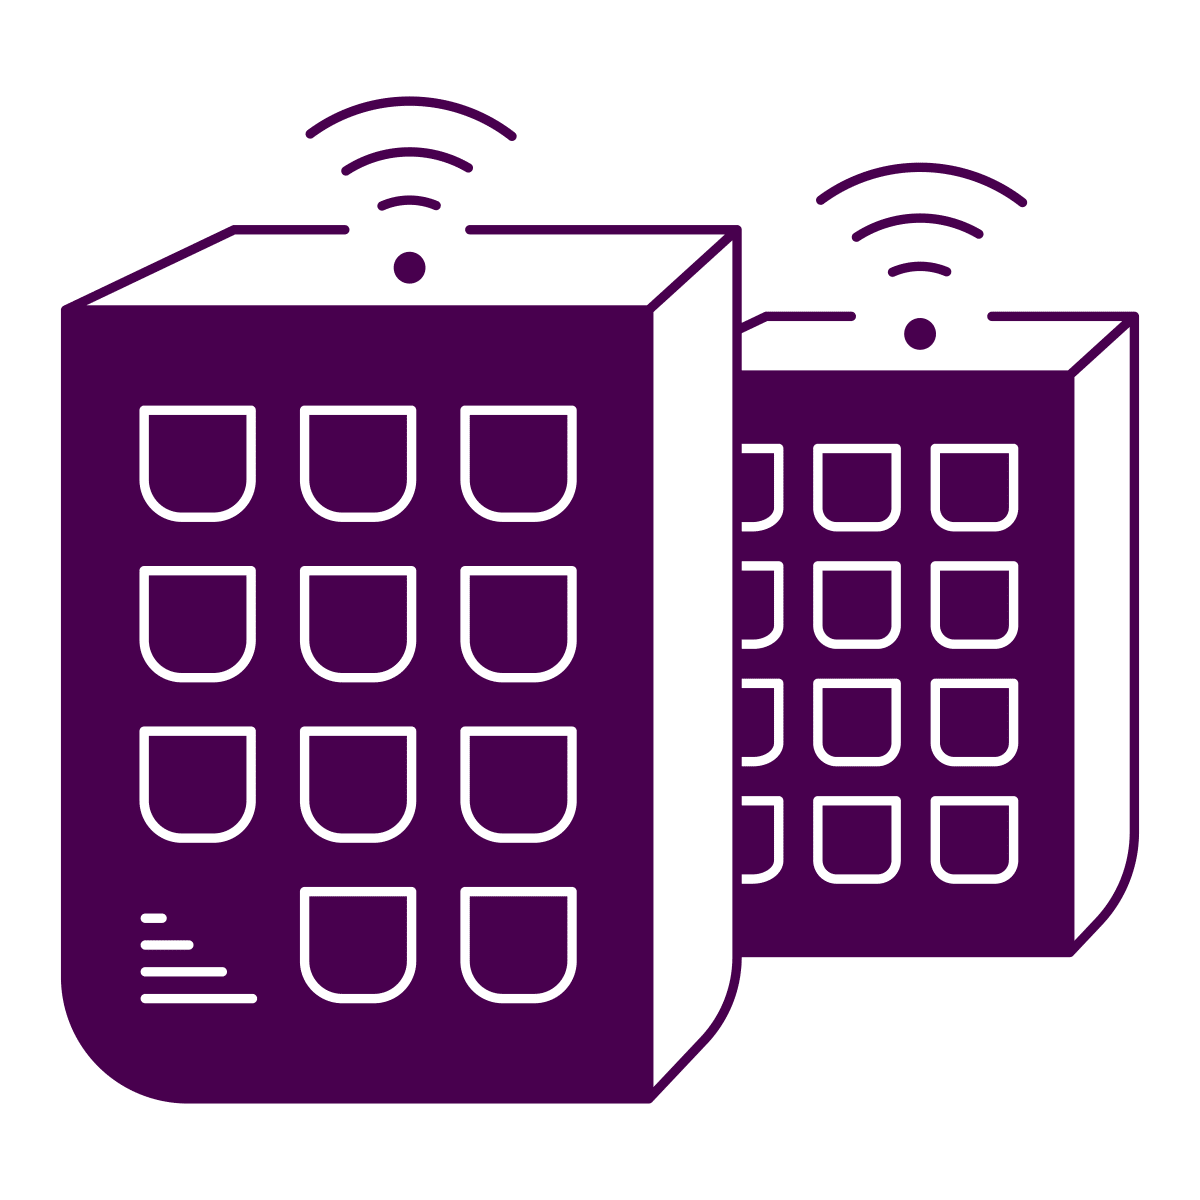 All of this produces more resilient systems. For example, digital twins are often used in building information management (BIM) systems. These systems can model all of the components of a building and its subsystems, such as electrical, plumbing, and HVAC. Using past performance metrics and current sensor data, you can establish a full view of your building and determine which aspects may be at risk for failure, enabling you to proactively forecast potential issues and create a more resilient system.
Energy reduction
 Combining real time energy usage with historical data through digital twins allows you to plan for and optimize energy usage across your system. For example, digital twins can be used to analyze energy consumption patterns across a network of buildings and equipment and compare this with energy prices throughout the day. This information allows you to buy and store energy at cheaper costs, and then supply this energy to the appropriate parts of your system based on need.
Cyber security resilience

Digital twins allow you to capture and visualize your cyber vulnerabilities, allowing you to remedy issues and fulfill reporting obligations, improving compliance with federal and industry standards. For example, digital twins enable you to perform network analysis across interlinked IT systems, identifying vulnerabilities and quarantining issues to prevent spread across the system and reduce the impact of cyber security threats.
Service level management verification
For organizations that outsource critical system operations and maintenance, digital twins can be used as an effective monitoring and measurement tool for service level compliance.

In addition to identifying which components of a system are due for maintenance, real time data collected via digital twins can enable verification that service level management agreements are being carried out and having the desired effect. For example, large facilities such as universities and military bases often outsource operation and maintenance of utilities, like water treatment plants, to a third party. However, with large facilities, it can be difficult and time consuming to verify that these service management contracts are being appropriately fulfilled. Digital twins provide effective tools for real-time performance monitoring of facility operations, with visual representations of critical system performance that can be used to ensure vendors are meeting or exceeding contract expectations.
Improved situational awareness
Digital twins allow you to visualize and analyze real time data to assess the health of not only individual components in a system, but of the overall system itself, allowing you to understand and improve your operational readiness.
What do knowledge graphs have to do with digital twins?
Digital twins can be created with a variety of technologies, including document databases, time series databases, and relational databases. Because of the different types and amounts of data necessary to model a real world entity in a digital environment, the information required to construct a digital twin is often split across multiple systems. Digital twins that involve real time sensor data can generate massive amounts of information that may need to be stored in dedicated systems for security or scalability purposes. These systems are often siloed and can’t be easily connected to other sources of information about the real world entity that they measure, leading to an incomplete picture of your assets and networks and making it difficult to perform complex analyses.
 Semantic knowledge graphs can serve as the “connective tissue” between these disparate systems, connecting data across different platforms. Using an ontology, or graph data model, you can create a schema that allows you to combine data from across multiple systems, acting as a blueprint to show how and where data should be connected. When combined with data transformation processes or virtualization technologies, this ontology can be used to create your knowledge graph, aggregating information about a real world entity from multiple sources and producing a 360 degree view of your system.
In addition to the technical limitations of connecting disparate systems in non-graph technologies, these different systems often use different data models and terminology to describe the same thing, making it hard to connect data even if it’s been aggregated in a single data warehouse or data lake. Developing an enterprise taxonomy allows you to “connect the dots” between different systems, linking system or department-specific terms to standardized concepts that can be applied across your organization and breaking down terminology barriers.
Additionally, because digital twins often involve complex networks of entities and relationships, knowledge graphs are an ideal way to model digital twin data. Knowledge graphs excel at capturing the complexity of the real world, and they store information in a way that’s intuitive, because data is stored in the same way that human beings think about and visualize information. Knowledge graphs are also much more flexible than traditional relational data models, making it easy to add, change, and remove data in order to respond to real world changes. This reduces the technical burden of creating data, and makes it easier for technical and business users alike to retrieve and understand information. Since digital twins are often used to create a representation of systems involving high degrees of connectivity and interdependence, the flexibility and intuitive nature of knowledge graphs make them a logical fit.
While generating a connected network of your explicit data often unlocks many analysis opportunities, semantic knowledge graphs can also allow you to create logical rules that are leveraged by machines to reason over data and draw inferences, generating new insights. This allows you to see how different components of a system may be connected without having to explicitly state every dependency and interaction. Employing inference over a graph network can be extremely powerful, uncovering cascading effects of changes of which you were previously unaware.
Outcomes
Using a knowledge graph to implement digital twins enables several key outcomes, including:
“What if” analysis
Simulation and modeling are critical tools for any engineering organization. Modeling the dependencies and interactions inside of a system using digital twins and knowledge graphs allows you to test out the potential effects of changes to the system before making them. For example, imagine you’re building a car, but one of the parts you’re using is climbing in cost, so you’d like to replace it with a substitute part from a different manufacturer. A digital twin would allow you to determine which subsystems of the car are impacted and analyze the requirements you’d need to meet in a replacement part.
Identify and fix problems in complex systems
Using real-time sensor data, digital twins can quickly alert you to any issues in your system, enabling you to meet condition based maintenance and reliability centered maintenance needs. With real time data logged to a digital twin, you can combine this information with other data about an asset, such as maintenance records and equipment specifications, allowing you to more efficiently identify the problem and quickly find a solution via data alone.
Identify problems before they occur
With streaming, real-time data, digital twins may allow you to identify potential problems before they occur. Combining real time data with historical data via a knowledge graph can enable predictive analytics, allowing you to discover patterns that may indicate an impending fault or failure. For example, analyzing past data may show that an HVAC unit consuming more power than usual while also missing the desired temperature setting by a few degrees may be in a degraded state and ready for service or a replacement. Taking proactive action to address the failing unit can prevent an actual failure, as well as the negative effects caused downstream to other components of your system that an HVAC failure might cause.
Conclusion
When combined with a knowledge graph, digital twins can be a powerful tool for capturing the interconnectivity and complexity of real world systems. The highly relational and flexible nature of knowledge graphs allows them to integrate data across multiple systems, giving you a full 360 view of your assets and their dependencies, increasing your situational awareness and improving the resilience of your systems. Need help getting started with digital twins and knowledge graphs? Contact us today.