
Where do I start? Whether it be a taxonomy, an ontology, or a knowledge graph, this is a common question that we get from clients when they are beginning their scoping journey. We get it. It is difficult to define solution requirements for a specific issue when there are multiple competing priorities and a myriad of anecdotal and systemic inefficiencies across the organization caused by siloed, inconsistent, or poorly managed information or data.
At EK, we strive to find a balance between the top-down and bottom-up perspectives during the scoping process. Our approach seeks to anticipate the most common needs of users while leaving the door open to meet the dynamic situations that emerge from the content or systems when users interact with them. There have been cases in which the information needed to spec out a solution is not available in business databases, policies, or content, and stakeholders don’t have any insights into user journeys due to the lack of concrete information emerging from the regular conduction of the business.
When the organization doesn’t have representative business content to leverage, a resource that might provide just the right information to launch your scoping journey is architecture diagrams. In a previous blog we enticed the idea that Entity Relationship Diagrams (ERD) can be used as blueprints to navigate and leverage the data stored in relational databases. In this entry, we will dive a bit deeper into the information represented in diagrams, specifically in UML diagrams, and discuss some of the advantages and pitfalls of utilizing them in the early stages of your solution design. We will also share examples of the types of UML diagrams that we’ve found most helpful during the solution modeling process.
What are UML diagrams and how can they supplement your solution scope?
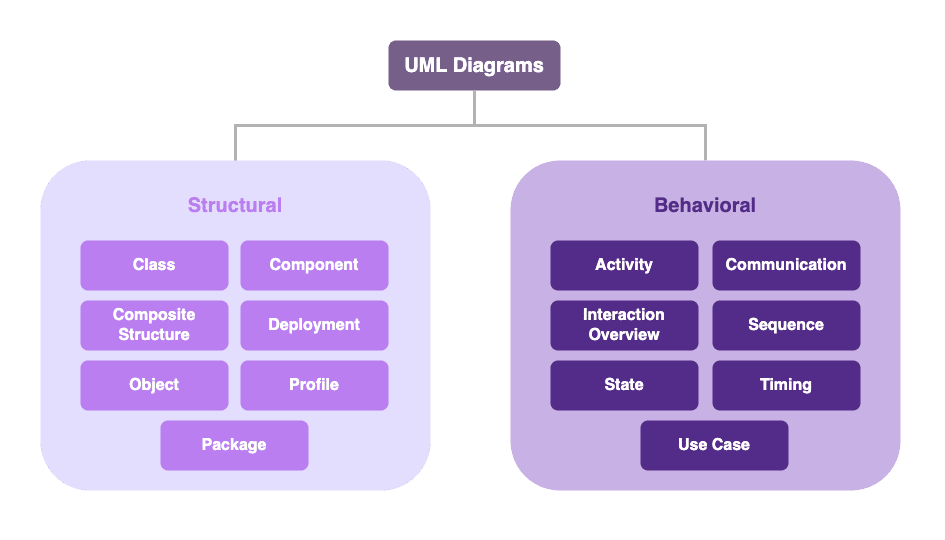
UML, shorthand for Unified Modeling Language, is a specification that allows IT professionals to represent the design and functionality of software systems through standard graphical elements: UML diagrams. There are fourteen UML diagram types grouped in two main categories: structural and behavioral. Structural diagrams show a system’s structure, behavioral diagrams show how a system should function.
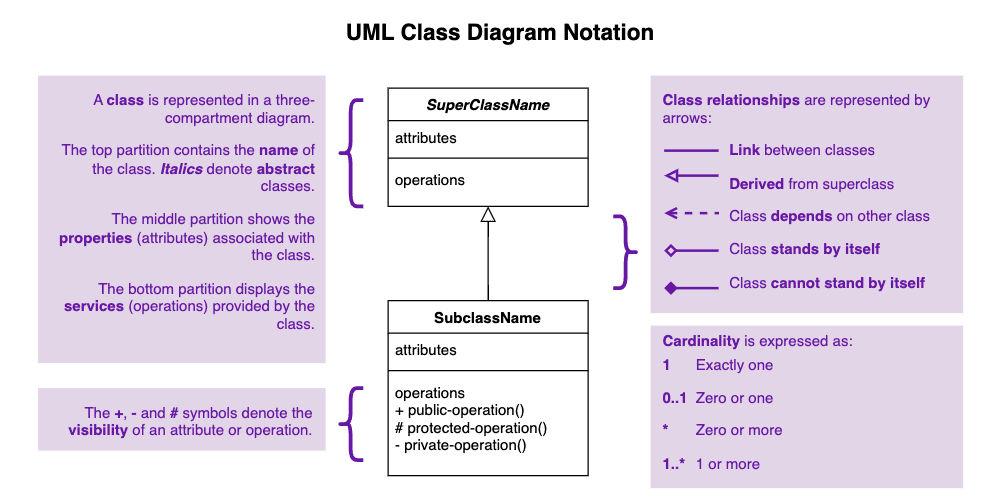
Given their capability to convey information in a syntactic and conventional format, these pictorial representations are some of the most popular tools in every software engineer’s toolkit. For the business owners and information managers, UML diagrams allow teams to visualize how a process is working, the sequence of tasks, how the data flows from one platform to another, and the systems that produce it. Below you will find a summary of the notation for a class diagram.
As you embark on your scoping journey, consider stress testing your solution’s requirements, functionalities, and assumptions against the organizational ecosystem illustrated in the UML diagrams. You can compare your design to the design of systems elsewhere in the organization, identifying points of alignment as well as the unique features of your own solution. This iterative exercise will let you construct a more accurate and complete picture of the agents, processes, scenarios, behaviors and data that you scoped.
A piece of advice before you move further down the page. It is important to warn you against the temptation to simply take any existing UML model and replicate it in your scope. Instead, you should analyze UML diagrams just as you would any other piece of content that you receive: assessing their shortcomings in their current state as well as their capabilities to support your envisioned “end state” solution.
Where do I start?
Now that we know that there are business artifacts that can function as charts to navigate the organizational information ecosystem, we can go back to the original question of where to start. In order to capitalize on the information contained in a UML diagram, first and foremost, you need to set a baseline that represents what you expect from your solution, whatever this might be. A simple way of visualizing your thoughts is to draw a diagram. You can use pen and paper, a whiteboard, or a diagramming software. For your drawing, think of the “things” that you want your model to represent and how they relate to each other.
In the initial phase, your drawing doesn’t have to be complete or accurate. What is important is that you capture the information that reflects your current view and understanding of the environment you will be operating in and the outcomes you would like to see. You should expect challenges, questions, and expansions to your original drawing. Changes are part of the development cycle, particularly during the initial stages.
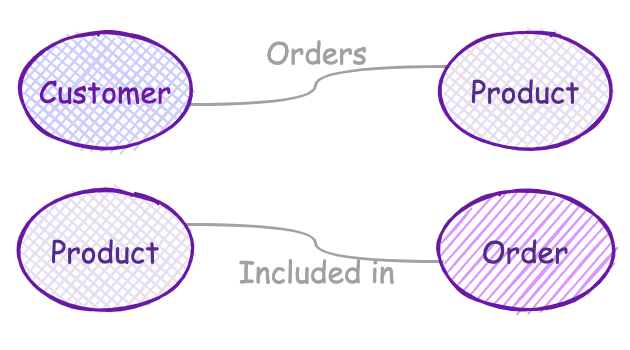
While you can start your definition process at any level of abstraction, try to think in “concrete” objects. As you grow in your modeling competency and knowledge of the environment, you will be able to incorporate more abstract concepts in your model. Some relatable examples might be customers, orders, and products. These will be your concepts and can be represented as labeled circles.

To represent relationships between concepts, you can simply draw a line from one circle to another and add a word or a short phrase that describes the connection.
Congratulations! You’ve successfully completed the first step in your scoping journey.
Talk to your stakeholders
At this point, you may want to show your diagram to stakeholders. The goal is to gather sufficient information that allows you to develop a functional definition for each one of the concepts and relationships that you originally came up with. This is particularly important if you are thinking about using your solution to support interoperable applications.
In our example above, the definition of what a product is may differ by department, team, or source of revenue. For instance, does product encompass services? Who is a customer? Can both people and organizations be customers? What information do we collect about them? Is a customer the same as a client, a patron, or a shopper (all terms currently in use by different teams)?
It doesn’t matter if your solution is centered around taxonomies, ontologies, or knowledge graphs. They all are about meaning. Explicit meaning allows people and machines to collect, process, and exchange information more efficiently, and reduces the risk of misinterpretation and downtime due to data incompatibility. It is worth the time and effort you spend clarifying and documenting the variations and nuances of each piece of content that you analyze.
Ask the DBAs for their UML diagrams
It is now time to use your knowledge of UML diagrams. In addition to your business owners, database administrators (DBAs) are a group you will want to reach out to during the early phases of your scope definition. Since their function is to design databases and structures for new and existing applications, DBAs usually have a grounded perspective of the overall application ecosystem and infrastructure of an organization. You should definitely seek their expertise to inform your solution design.
You need to be strategic and determine the type of diagram that could provide the information that you need to consolidate your initial design. When you meet with the DBAs, ask them to walk you through their UML diagrams. Do they validate the concepts or relationships that came out of your initial “pen and paper” drawing?
If you go back to the types of diagrams listed at the beginning of this post, you will notice that there is a diagram that allows software engineers to represent classes and relationships: the Class diagram. The following image is representing the same concepts from our example above: customer, order, and product.
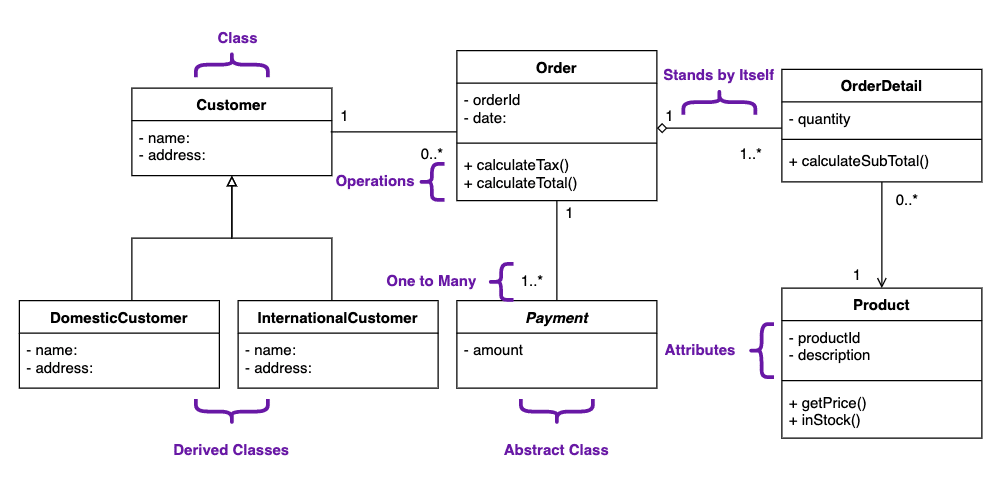
By studying these drawings, you can start filling gaps in your knowledge, refining or reassuring your initial assumptions and understanding. Once again, you must make the extra effort not to replicate what currently exists. The goal with this analysis is to identify reusable elements but, more importantly, to make note of any missing pieces that are critical to the success of your solution. In our original drawing for instance, we had considered concepts for customer, product, and order. By inspecting the UML diagram we realize that it might be worth considering adding the concept of payment to our ontology or breaking down the product concept into more specific subconcepts. We can also reach the conclusion that our solution does not require distinguishing between domestic and international customers.
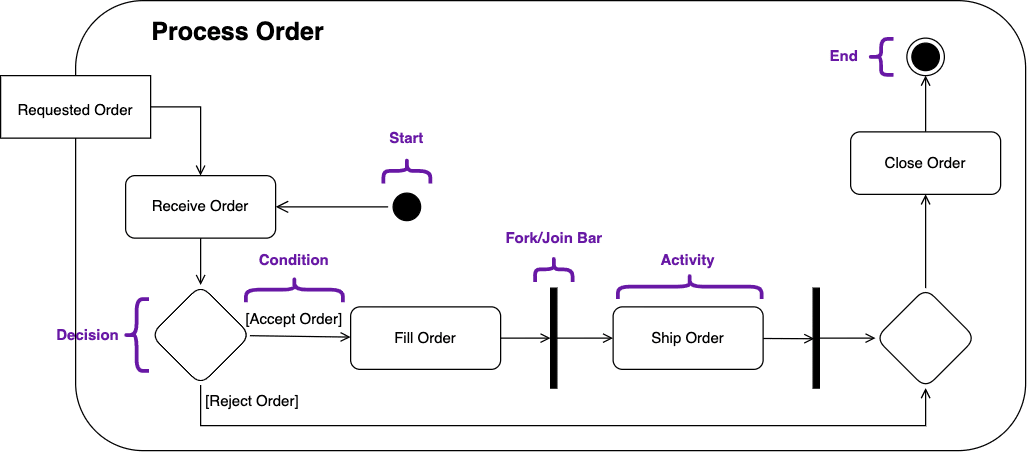
Another common situation is when a solution demands that you specify the causes for an event. In those cases, an Activity diagram might be a more appropriate artifact to analyze since they denote the actions, decision points, flows, start and end points of a given process.
In the diagram below, we are showcasing the standard notation for Activity diagrams and specifying what happens when a customer places an order. Once again, compare against your “pen and paper” drawing. Do you need a concept for the shipping company or the agent that processes, fills, and closes the order?
As a final word, we would like to reiterate that it is extremely easy to get caught on the details of what currently exists. Try to steer clear from discussing particulars such as the names of tables, columns, and data types, or to try to pin down the specifics of any existing platforms and deployments. At the onset, you should strive to define your solution in system-agnostic terms and detach it from specific implementations. Your ultimate goal when consulting UML diagrams is to help you determine what’s in and out of scope as well as the essential components of your desired solution. This is how you start assessing information gaps, prioritizing systems, clarifying processes, and identifying key partners and stakeholders to collect additional input. Not a bad place to start!
Conclusion
Many of our projects have benefited from incorporating UML diagrams as part of the initial information gathering activities. This is no surprise. UML diagrams are concise sources of information that can augment, validate, prove or disprove the assumptions, preconditions, and requirements established in preliminary scopes or solution designs.
For more information on case studies where we’ve leveraged these techniques to scope solutions or to get help doing so for your organization, contact us at info@enterprise-knowledge.com.