
Content personalization is no longer optional for companies. A personalized digital experience is essential to creating loyal customers, partners, and employees. The leading technology companies have created an expectation of highly contextualized information that answers customer questions and anticipates future needs. Fortunately, some of the latest technology trends address this challenge and allow organizations to personalize information in a meaningful and cost effective manner. Two of the most important tools for effective content personalization are:
- Componentized Content Management Systems (CCMS) and
- Knowledge Graphs (Graph).
A CCMS allows organizations to create and manage content so that people receive only the information they need. A Graph allows organizations to better target what information should be delivered. In the rest of this blog post, I am going to explain how these two tools work to provide the best possible content personalization experience. To keep things simple, I am going to refer to the receiver of this personalized information as a customer, although these concepts could easily apply to personalization for partners and employees as well.
Tool 1: Bite-Sized Content Components
A CCMS supports the content side of the personalization equation. It allows organizations to author and manage content in components or sections rather than long documents. Componentized content is structured content that represents a portion of a larger document (typically a chapter or section) that can be combined to build documents dynamically. A great example of this is your car’s owners manual. This manual has instructions for changing a tire, filling the wiper fluid, and jump starting the car. Dividing the content of the owners manual into components allows the manufacturer to send only the jump starting instructions when that is what the customer needs.

Truly effective personalization requires this division of content so that the customer gets only the information they need and not extraneous information. Imagine you are a product manufacturer and you sell multiple products, many of which use the same or similar parts. As you interact with customers, it is important that the information that you provide to them is limited to products that they own or related products that would be of interest. A CCMS allows organizations to deliver individual components to directly answer questions or to dynamically assemble larger manuals that include only information relevant to the products the customer owns. This level of personalization reminds the customer that you understand who they are and that you value their time. A common phrase in Knowledge Management is “Deliver people the right information at the right time!”. A CCMS helps ensure that the right information can be delivered in a way that is specific and relevant to the user.
Tool 2: Knowledge Graphs
Once the information is componentized the personalization platform needs a way to decide what information is the right information to share with the customer. This is where Knowledge Graphs provide a level of control over personalization that is new and much more powerful than prior technologies. Knowledge graphs deliver on personalization through two key features: aggregation and inference.
Graphs are very good at aggregating information from multiple sources. This is the use case that Google shows with their famous knowledge panels (the information about people, places, and things that show on the right side of the search results). A graph can pull information about customers from multiple sources such as the CRM system, product support tickets, and sales information. This aggregated view means that the graph can be used to determine which content chunks should be assembled together to best align with the purchases and concerns of the customer. The CCMS produces the chunked content and the graph assembles the “right” chunks of content and delivers them to the customer based on what the graph knows about the customer.
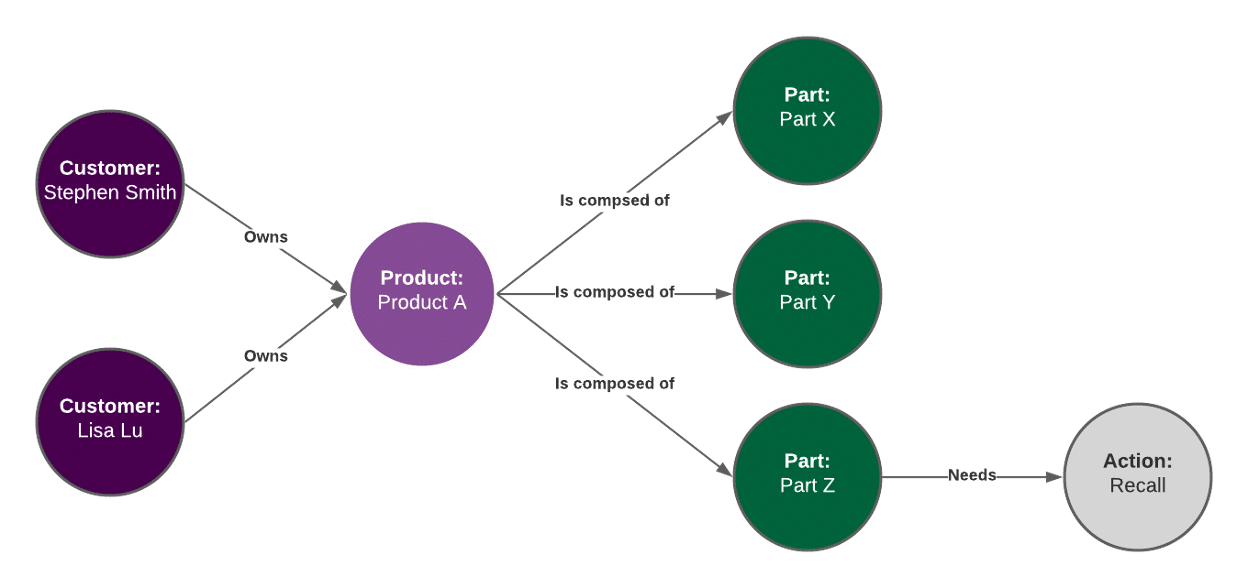
A graph can aggregate more than just information about a customer. Graphs are also used to aggregate information about the products and services of an organization. This information can come from the product information management system, the product catalog, and ticketing systems. With this information, the graph can look at the products a customer owns and the latest information about those products so that highly targeted and almost predictive information can be delivered to customers. For example, a customer may own a product that has had a recent recall. The CCMS stores information about how to get the recall and how to install the solution. The graph is able to proactively see that the customer owns this product from the customer portion of the graph and then identify that the product has a recall from the product portion of the graph. The organization can then send a highly personalized and targeted message that explains what the recall is and how to install the solution. This type of proactive personalization can turn a potentially negative situation into a more positive engagement. A simplified example of how the graph provides this information can be seen in the image below.
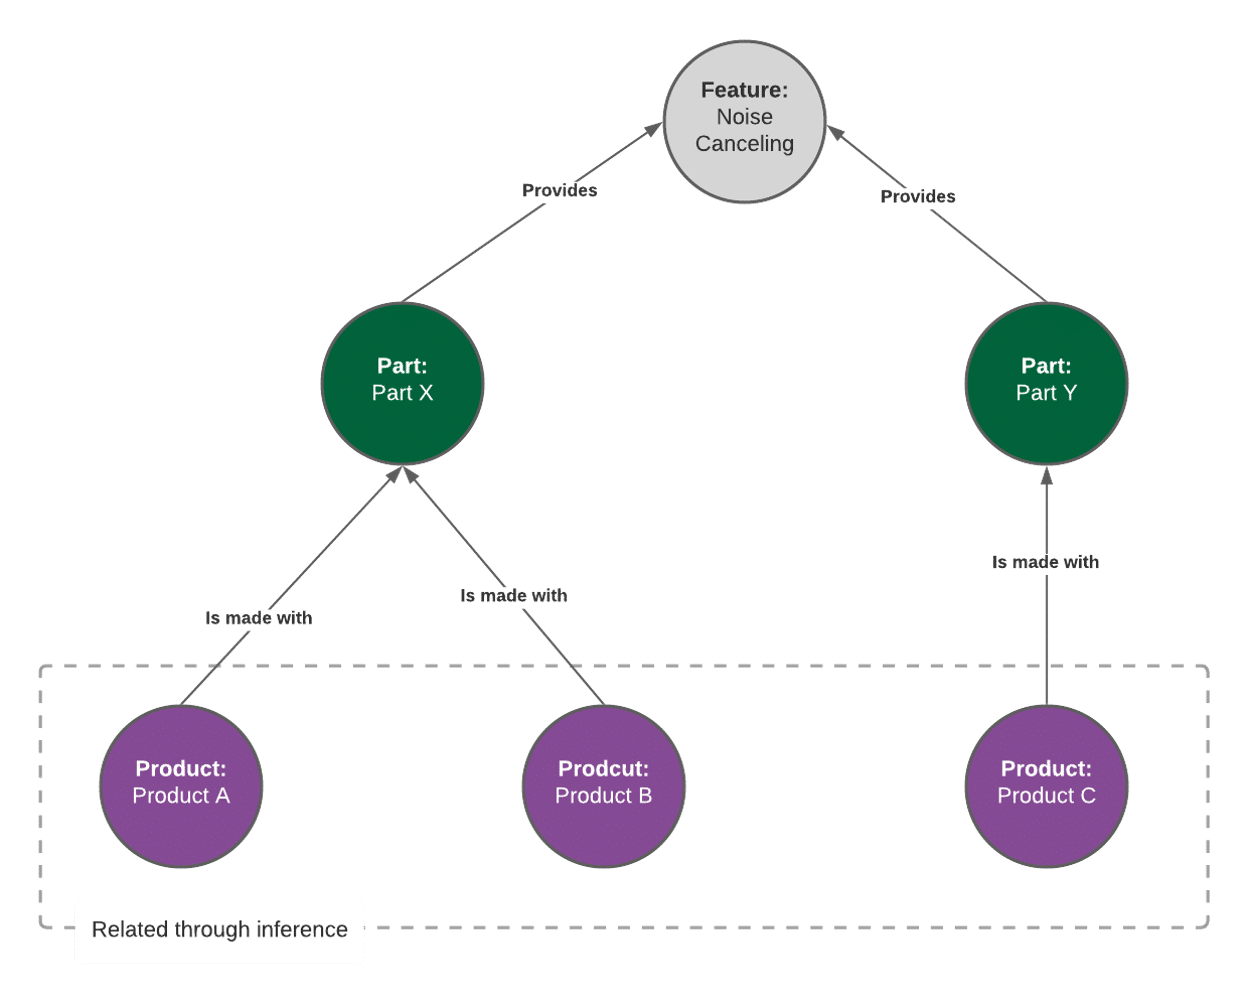
Additional personalization can be offered through a feature in graphs called inference. Inference occurs when two entities in the graph are seen as related because they have relationships in common. For example, two products that a company offers might use a part that lowers noise. A third product might use a different part, but one that also offers noise canceling features. Even though these products are not directly related we can infer that they are similar because the parts that they use have a similar characteristic (see the image below).
Inference allows organizations to personalize recommendations in a way that could not easily be done with older technologies. This opens a new path for personalization that allows for even more proactive content interactions with both customers and prospects.
Summary
Componentized Content Management Systems and Knowledge Graphs are foundational elements that are key to providing content personalization. Organizations that personalize customer, employee, and partner experiences with these tools can create compelling digital experiences that surprise and delight. Our content management and graph specialists can help your organization build a true cutting edge personalization platform. If you are interested in learning more about our services in this area, you can reach us at info@enterprise-knowledge.com.