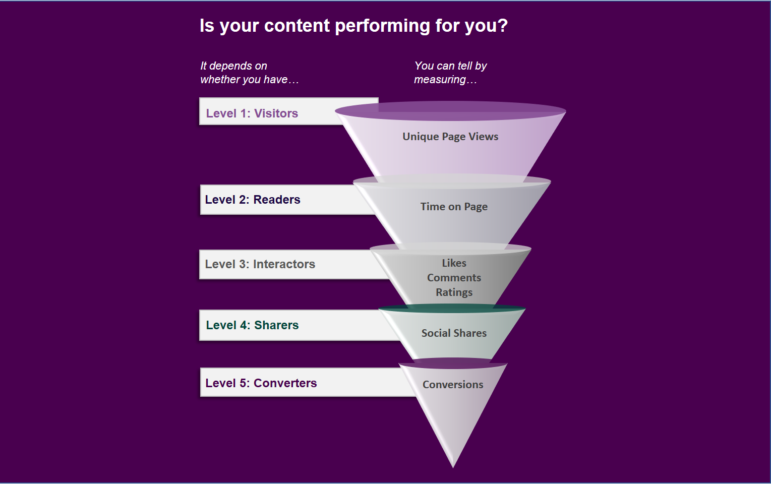
Whether you’re building an internal employee portal or public facing website, it’s critical to measure the effectiveness of your content. Although the analytics you capture can be as basic or complex as the maturity of your content strategy team, there are 5 common key indicators that will tell you whether or not your content is performing for you.
1. Are people viewing your content?
This is the most logical place to start. The number of page visits tells you how many people are actually landing on each page of your site. This can indicate the relative popularity of each page and can reveal whether there are pages on your site that no one has ever visited.
Make sure to distinguish total views vs. unique views to get a good picture of how many individuals are actually visiting. If you want to get a bit more sophisticated, see how those visits breakdown by demographics, location, source, and/or device. The insights you gain from analyzing this information should inform the changes you make to your content.
Keep in mind though that page visits is only the tip of the iceberg. In fact, site traffic may only indicate the effectiveness of your marketing or campaign efforts, rather than your content itself. A site visit means that someone got wind that your content existed, say on social media for example, and they found the headline or image associated with your content intriguing enough to check it out.
To determine how many visitors are actually sticking around, you’ll want check your number of page visits against each page’s bounce rate, or the number of times someone landed on a page, then hit the back button on their browser. This will tell you that these people did not find what they were looking for.
2. Are people reading through your content and to other related content?
Let’s say you’ve successfully attracted your target audience and now they are reading through the content on the page. Another key indicator is the time spent on each page. Are they only on the page for a few seconds? Then, maybe they quickly got frustrated at your content’s lack of clarity or relevance. If you find that on average, your readers are spending 3-5 minutes on each page, then you know that there is enough on that page to keep their attention.
Even further, if your site has a feature to suggest relevant content, you can evaluate a reader’s journey, or page path, through your site. If their journey indicates breadth and depth of visits across and through your site, this is an indication that people are not only finding your content, reading through it, but they’re also interested in other information you have to offer.
3. Are people interacting with your content?
The next level of engagement is interaction with your content. Often times, you may choose to disable features such as likes, comments, ratings, etc. if you don’t have the bandwidth to patrol it, but they can be quite insightful into what people like or don’t like about your content. You can then use this information to serve up more of what they like and less of what they don’t like.
4. Are people sharing your content?
Beyond interaction with your content, social shares indicate an even higher level of engagement from your target audience. When people share your content via email and/or social media, this means that not only do they find it interesting and/or helpful, but they also think that people in their network would appreciate it as well. Social shares bring increased traffic to your site and is often the most effective (and free) way to get the word out there about what you have to offer.
5. Are people taking action on your content?
Lastly, and most importantly, you want to track conversions. All of your content should have the intention of getting your readers to actually do something. Whether it’s downloading information, purchasing a product or service, or even just capturing email addresses for leads, you want to track what percentage of your site traffic is doing what you ultimately want them to do.
When developing your analytics strategy, you will want to measure only what’s relevant to your organization or the specific campaign you’re working on. Your most significant Key Performance Indicators (KPIs) may be conversions for an e-commerce site or interactions for an employee portal. There are so many things you could measure, but what’s important is that you measure what aligns with your objectives and what you’re willing to act on. If you’re overwhelmed by all of numbers and graphs on your Google Analytics dashboard, native social media analytics tools, CRM or CMS analytics tools, and/or whatever you use, then these top 5 indicators are a great place to start.
Need help making sure your content is performing for you? Contact us at info@enterprise-knowledge.com.