
This white paper will unpack what semantics is, and walk through the benefits of a semantic approach to your organization’s data across search, usability, and standardization. As a knowledge and information management consultancy, EK works closely with clients to help them reorganize and transform their organization’s knowledge structure and culture. One habit that we’ve noticed in working with clients is a hesitancy on their part to engage with the meaning and semantics of their data, summed up in the question “Why semantics?” This can come from a few places:
- An unfamiliarity with the concept;
- The fear that semantics is too advanced for a lower data-maturity organization; or
- The assumption that problems of semantics can be engineered away with the right codebase
These are all reasons we’ve seen for semantic hesitancy. And to be fair, between the semantic layer, semantic web, semantic search, and other applications, it can be easy to lose track of what semantics means and what the benefits are.
What is Semantics?
The term semantics originally comes from philosophy, where it refers to the study of how we construct and transmit meaning through concepts and language. This might sound daunting, but the semantics we refer to when looking at data is a much more limited application.
Data semantics looks at what data is meant to represent – the meaning and information contained within the data – as well as our ability to encode and interpret that meaning.
Data semantics can cover the context in which the data was produced, what the data is referring to, and any information needed to understand and make use of the data.
To better understand what this looks like, let’s look at an imaginary example of tabular data for a veterinary clinic tracking visits:
| Name | Animal | Breed | Sex | Date | Reason for Visit | Notes |
| Katara | Cat | American Shorthair | F | 11/22/23 | Checkup | |
| Grayson | Rabbit | English Lop | M | 10/13/23 | Yearly Vaccination | |
| Abby | Dog | German Shorthaired Pointer | F | 9/28/23 | Appointment | Urinary problems |
My Awesome Vet Clinic
Above, we have the table of sample data for our imaginary veterinary clinic. Within this table, we can tell what a piece of data is meant to represent by its row and column placement. Looking at the second row of the first column, we can see that the string “Katara” refers to a name because it sits under the column header “Name”. If we look at the cell to the right of that one, we can see that Katara is in fact the name of a Cat. Continuing along the row to the right tells us the breed of cat, the date of the visit, and the reason that Katara’s owners have taken her in today.

The real-life Katara, watching the author as he typed the first draft of this white paper
While the semantics of our table might seem basic compared to more advanced applications and data formats, it is important for being able to understand and make use of the data. This leads into my first point:
You are Already Using Semantics
Whether you have a formal semantics program or not, your organization is already engaging with the semantics of data as a daily activity. Because semantics is so often mentioned as a component of advanced data applications and solutioning, people sometimes wrongly assume that enhancing and improving the semantics of data can only be a high-maturity activity. One client at a lower-maturity organization brought this up directly, saying “Semantics is the balcony of a house. Right now what I need is the foundation.” What they were missing, and what we showed them through our time with this client, is that understanding and improving the semantics of your data is a foundational activity. From how tables are laid out, to naming conventions, to the lists of terms that appear in cells and drop-downs, semantics is inextricably linked to how we use and understand data.
Achieving Five-Star Semantic Data
To prevent misunderstandings, we need to improve our data’s semantic expressiveness. Let’s look at the veterinary clinic data sample again. Earlier, we assumed that “Name” refers to the name of the animal being brought in, but suppose someone unfamiliar with the table’s setup is given the data to use. If the clinic’s billing needs to make a call, will they realize that “Katara” refers to the name of the cat and not the cat’s owner, or will they make an embarrassing mistake? When evaluating the semantics of data, I like to reference Panos Alexopoulos’s book Semantic Modeling for Data. Here, Panos defines semantic data modeling as creating representations of data such that the meaning is “explicit, accurate, and commonly understood by both humans and computer systems.” Each of these is an important component of ensuring that the semantics of our data support use, growth over time, and analysis.
Explicit
Data carries meaning. Often the meaning of data is understood implicitly by the people who are close to the production of the data and involved in the creation of datasets. Because they already know what the data is, they might not feel the need to describe explicitly what the data is, how it was put together, and what the definition of different terms are. Unfortunately, this can lead to some common issues once the data is passed on to be used by other people:
- Misunderstanding what the data can be used for
- Misunderstanding what the data describes
- Misunderstanding what data elements mean
When we look at the initial tabular example, we know that Katara is a cat because of the table’s structure. If we were to take the concept of “Katara” outside of the table, though, we would lose that information–”Katara” would just be a string, without any guidance as to whether that string refers to Katara the cat, Katara the fictional character, or any other Kataras that may exist.
To handle the issue of understanding what the data can be used for, we want to capture how the data was produced, and what it is meant to be used for, explicitly for consumers. Links between source and target data sets should also be called out explicitly to facilitate use and understanding, instead of being left to the reader to assume.
What the data describes can be captured by modeling the most important things (or entities) that the data is describing. Looking at our veterinary clinic data, let’s pull out these entities, their information, and the links between them:
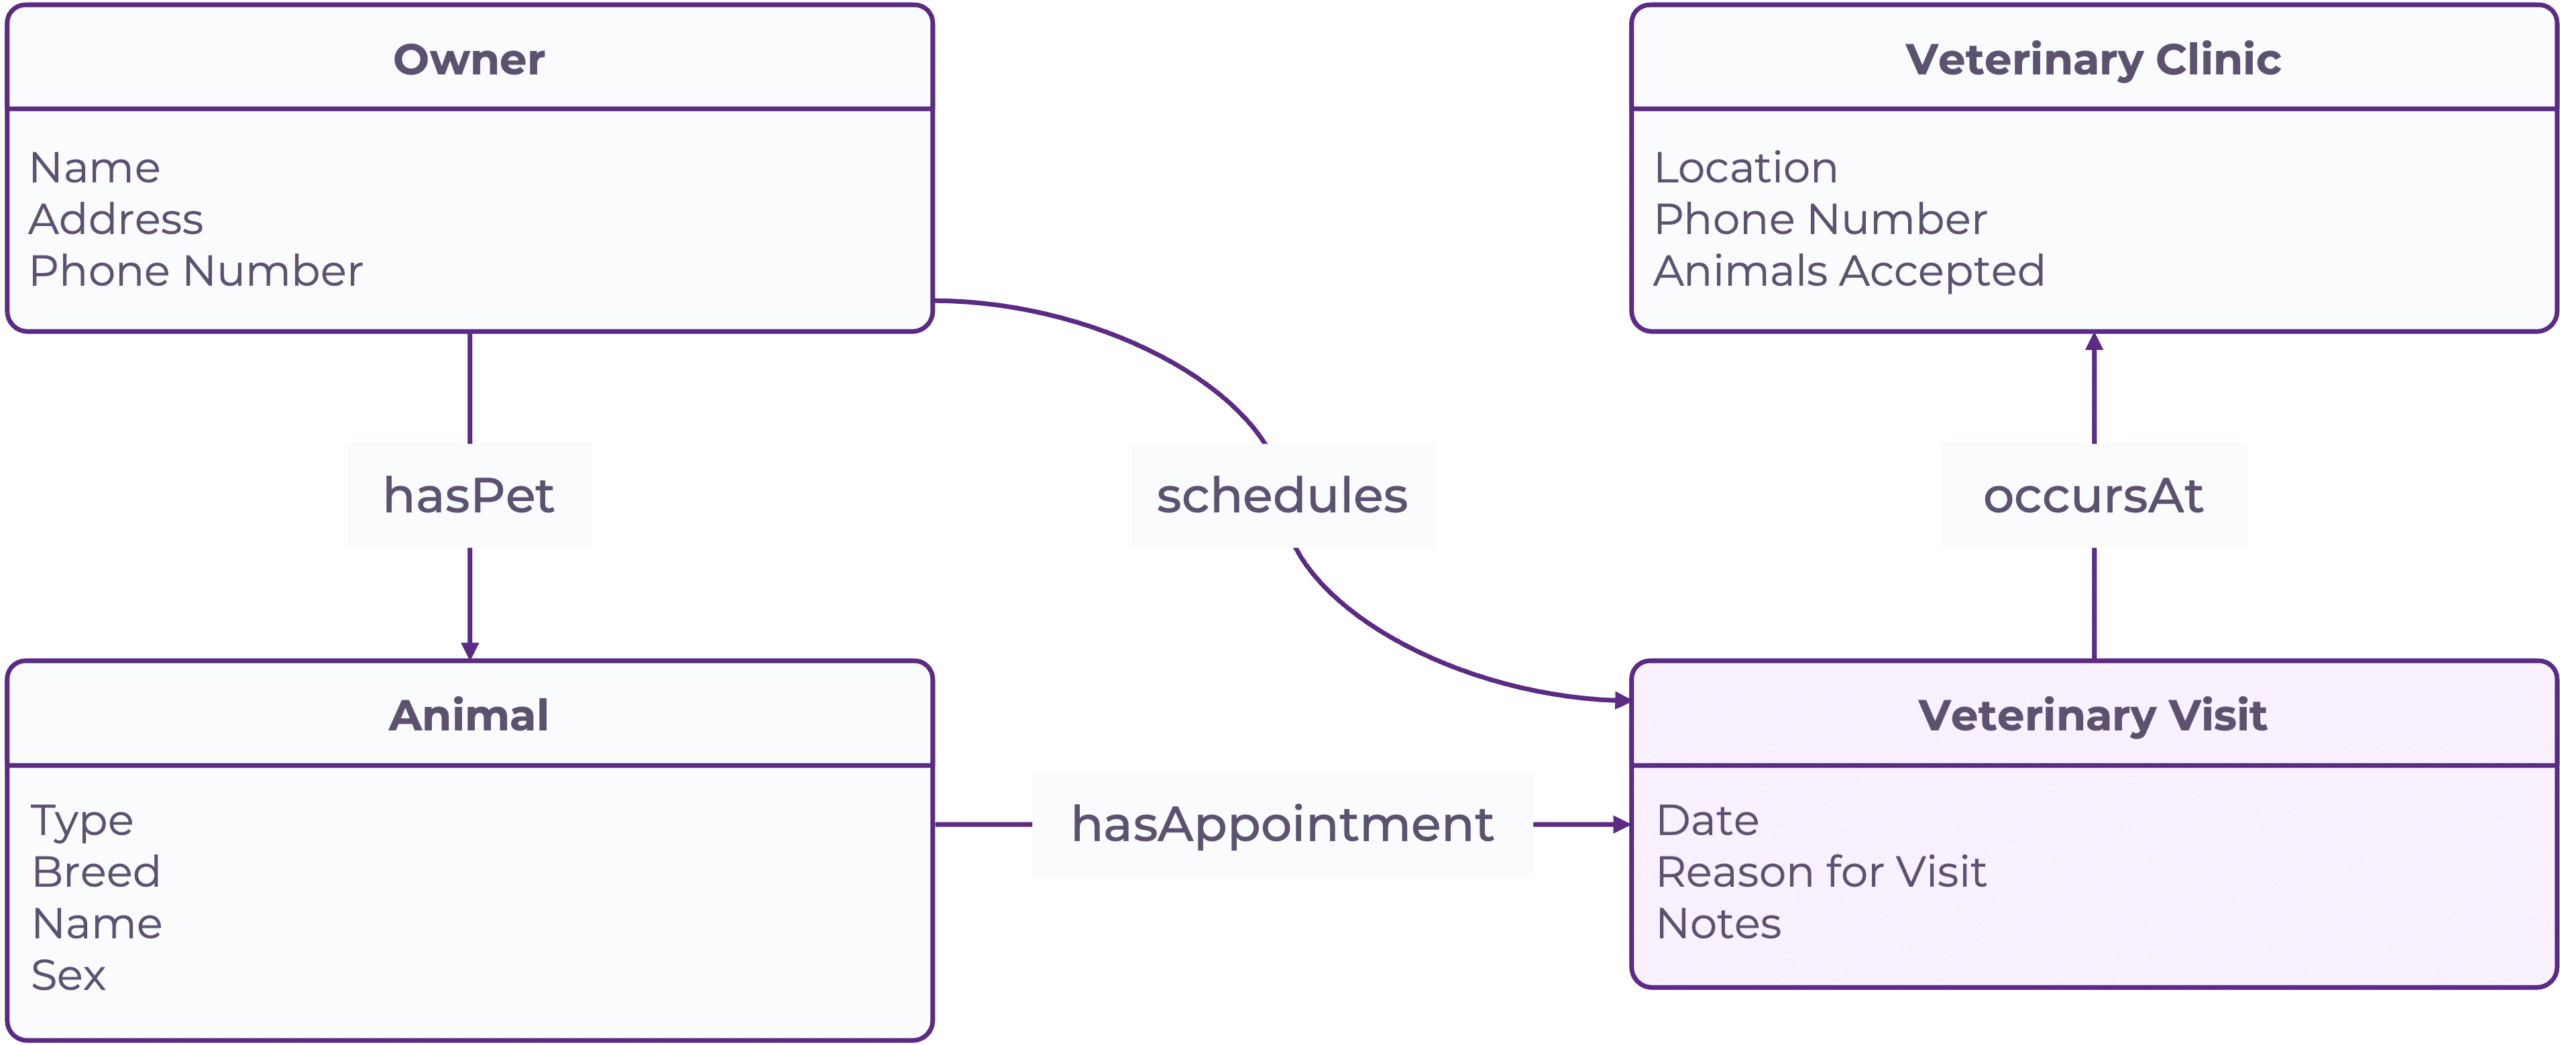
A sample conceptual model for the veterinary clinic information, adding in some additional information such as phone number and address
We now have the beginnings of a conceptual model. This model is an abstraction that identifies the “things” behind the data–the conceptual entities that the information within the cells is referring to. Because the model makes relationships between entities explicit, it helps people new to the data understand the inherent structure. This makes it easier to join or map new datasets to the dataset that we modeled.
Finally, to capture what data elements mean, we can make use of a data dictionary. A data dictionary contains additional metadata about data elements, such as their definition, standardized name, and attributes. Using a data dictionary, we can see what allowable values are for the field “Animal”, for instance, or how the definitions of an “appointment” vs a “checkup” differ.
Accurate
Data should be able to vouch for its own accuracy to promote trust and usage. It is also important for those accuracy checks to be human-readable as well as something that can be used and understood by machines. It might seem obvious at first glance that we want data to be accurate. Less obvious is how we can achieve accuracy. To ensure our data is accurate, we should define what accuracy looks like for our data. This can be formatting information: dates should be encoded as YYYY-MM-DD following the ISO 8601 Standard rather than Month/Day/Year, for example. It can also take the form of a regular expression that ensures that phone numbers are 10 digits with a valid North American area code. Having accuracy information captured as a part of your data’s semantics works both to ensure that data is correct at the source, and that poor, inaccurate data is not mixed into the dataset down the line. As the saying goes, “Garbage in, garbage out.”
Machine Readable
Looking back to our conceptual diagram, it has a clear limitation. Human users can use the model to understand how entities in the data link together, but there isn’t any machine readability. With a well-defined machine-readable model, programs would be able to know that visits are always associated with one animal, and that animals must have one or more owners. That knowledge could then be used programmatically to verify when our data is accurate or inaccurate. This is the benefit of machine-readable semantics, and it is something that we want to enable across all aspects of our data. One way of encoding data semantics to be readable by humans and machines is to use a semantic knowledge graph. A semantic knowledge graph captures data, models, and associated semantic metadata in a graph structure that can be browsed by humans or queried programmatically. It fulfills the explicit semantics and accuracy requirements listed above in order to promote the usability and reliability of data.
Example: Solving for Semantics with a Knowledge Graph
To demonstrate what good semantic data can do, let’s take our data and put it into a simple semantic knowledge graph:
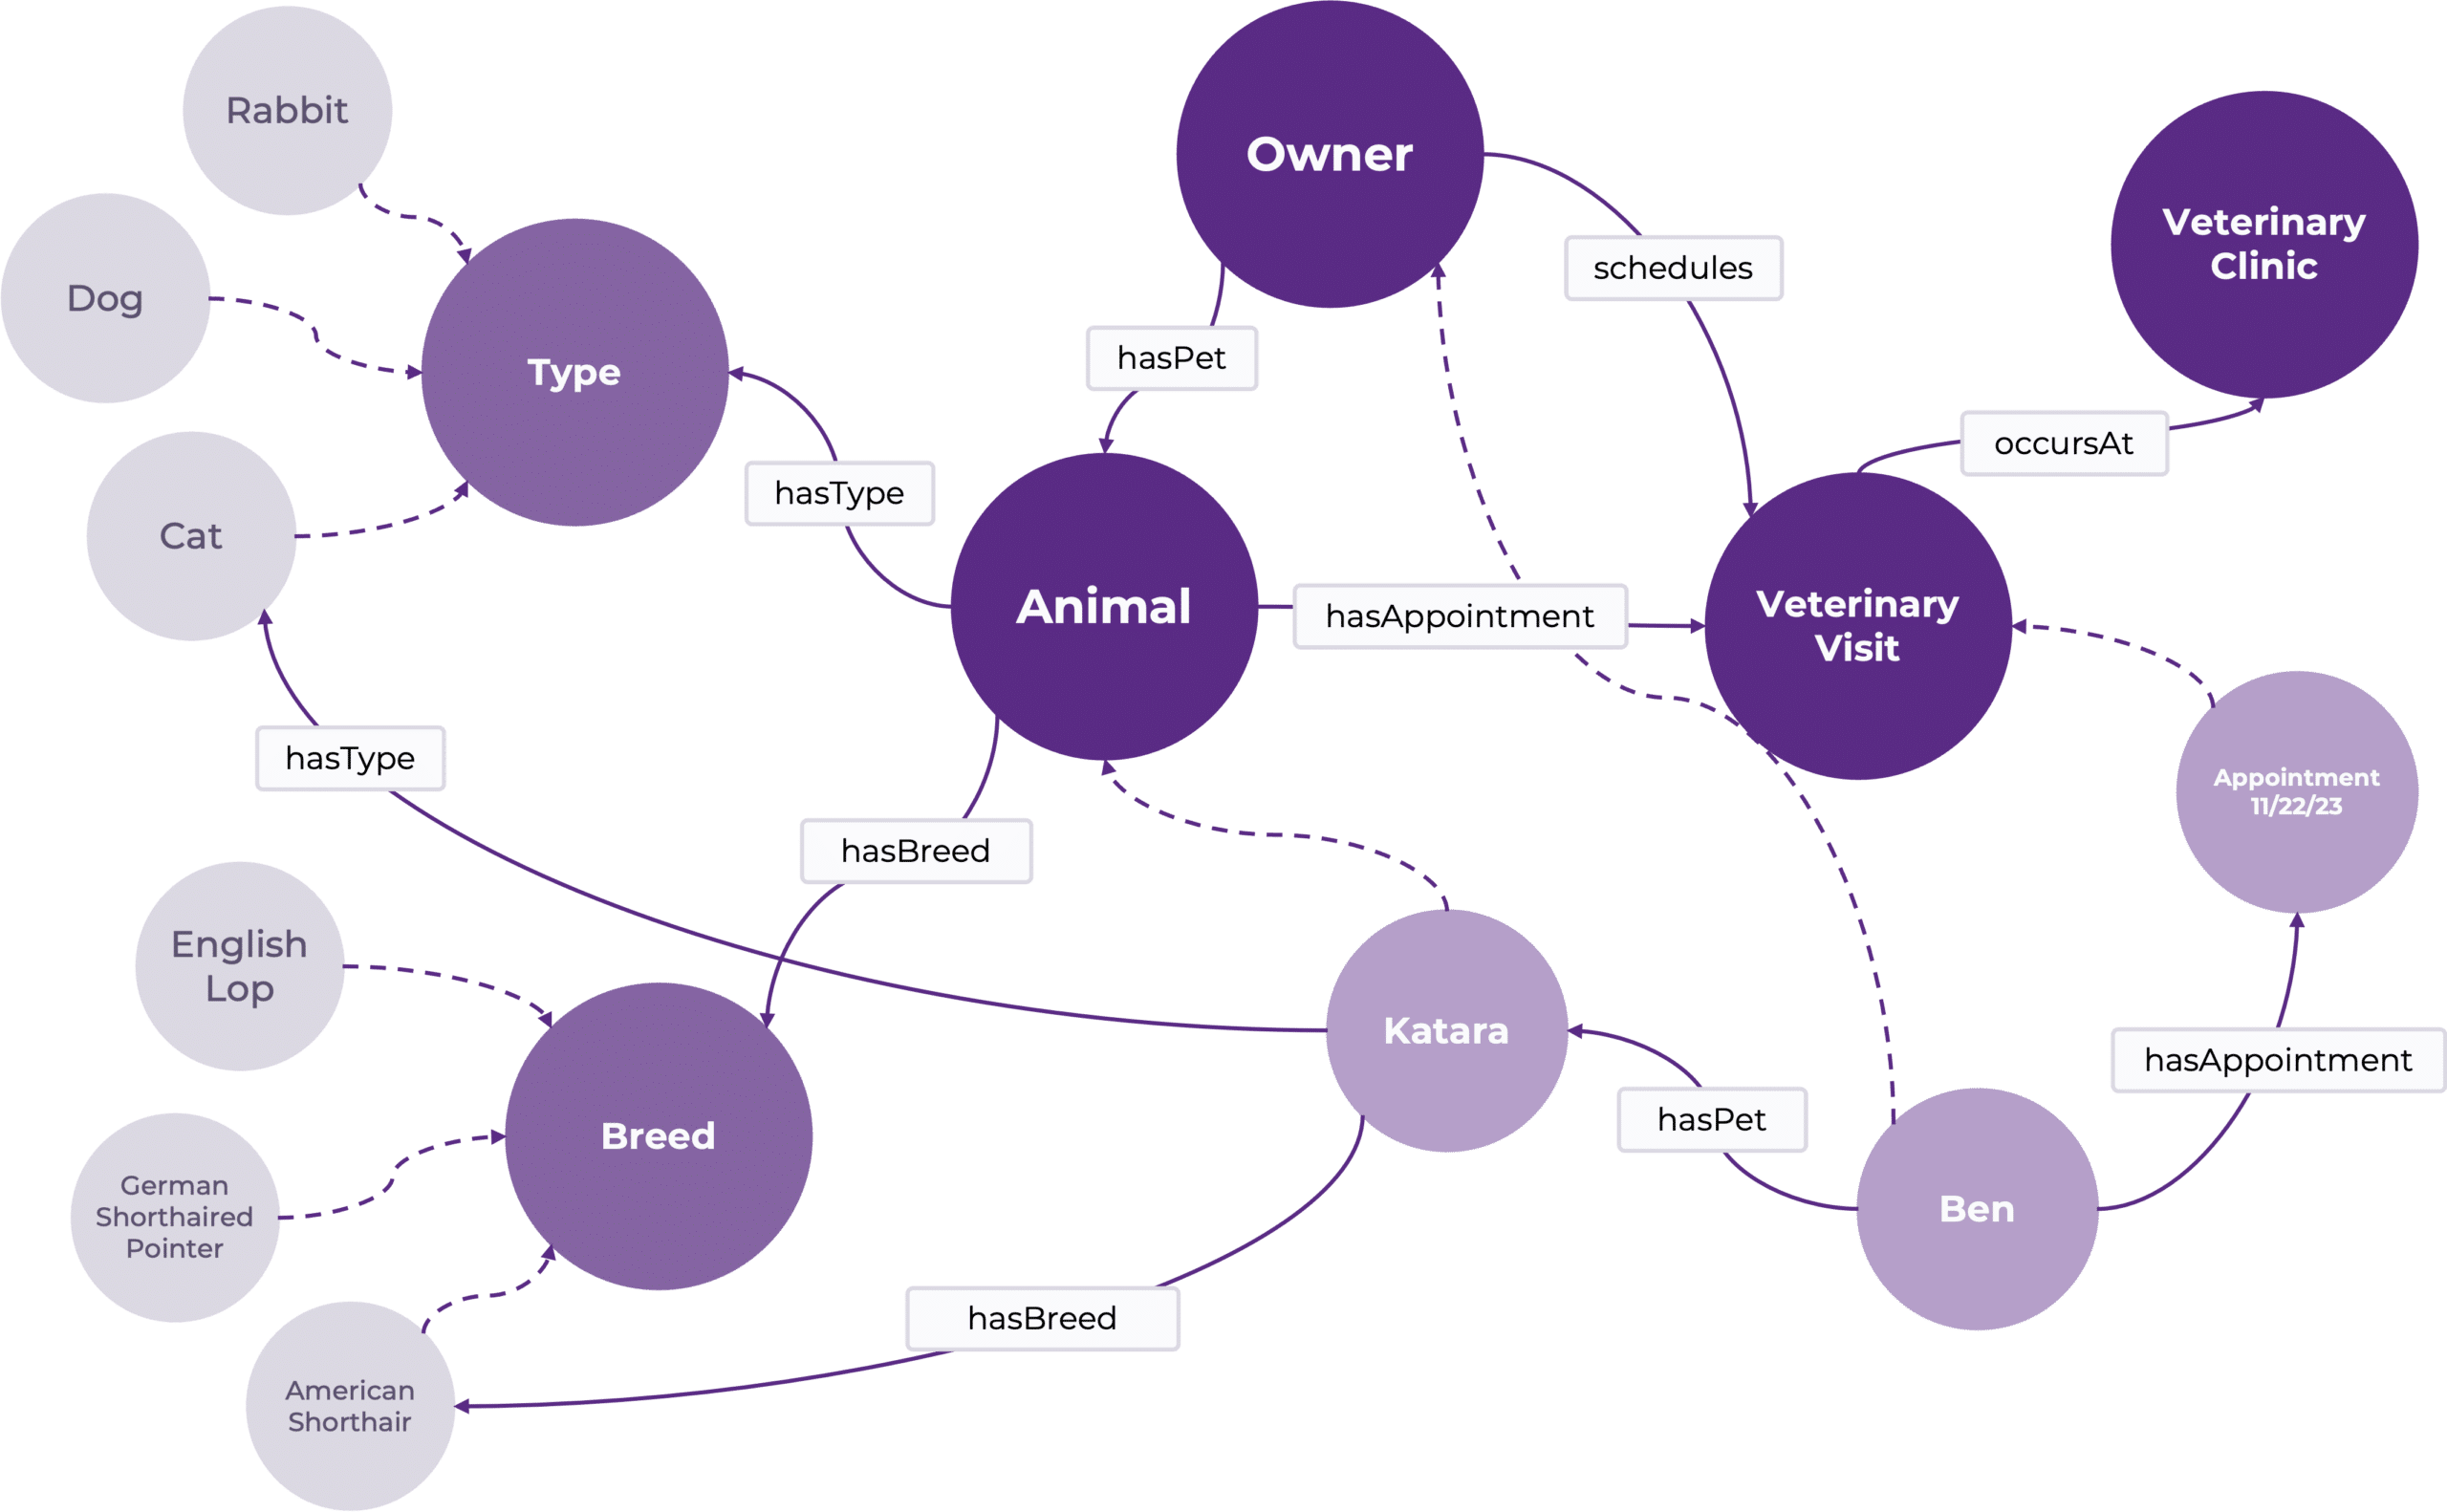
Sample knowledge graph based on our veterinary clinic data
Within this graph, we have made our semantics explicit by defining not just the data but also the model that our data follows. The graph also captures the data concept information that we would want to find in a data dictionary. If we want to know more about any part of this model – for example, what the relationship “hasBreed” refers to – we can navigate to that part of the model and find out more information:
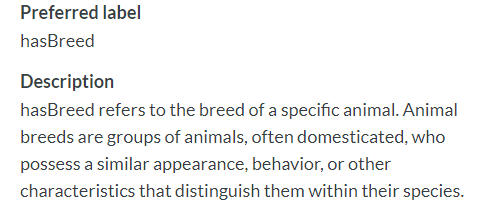
The definition of the relationship “hasBreed” within the model
Within the graph model, we’ve captured the taxonomies that can be used to fill out information on an animal’s Type and Breed as well as cardinality of relationships to ensure that the data and its use remains accurate. And, because we are using a knowledge graph, all of this information is machine readable, allowing us to do things like query the graph. Going back to the first example, we can ask the graph for the name of Katara’s Owner vs Katara’s Name to receive the contextually correct response (see the sample SPARQL query below).
SELECT ?PetOwnerName ?PetName
WHERE {
?PetOwner hasPet ?Pet .
?PetOwner schema:name ?PetOwnerName .
?Pet schema:name ?PetName .
}
Rather than having to guess at the meaning of different cells in a table, our three components of good semantics ensure that we can understand and make sense of the data.
| ?PetOwnerName | ?PetName |
| Ben | Katara |
| Shay | Grayson |
| Michael | Abby |
Example csv result based on the above SPARQL Query
Conclusion
This article has walked through how semantics is a core part of being able to understand and make use of an organization’s data. For any group working with data at scale, where there is a degree of separation between data producers and data consumers for a given dataset, having clear and well-documented semantics is crucial. Without good semantics, many of the fundamental uses of data run into roadblocks and difficulties. Ultimately, the important question to ask is not “Why semantics?”, rather “Where does semantics fit into a data strategy?” At Enterprise Knowledge, we can work with you to develop an enterprise data strategy that takes your needs into account. Contact us to learn more.