
My colleagues Joe Hilger and Neil Quinn recently wrote blogs highlighting the benefits of leveraging a knowledge graph in tandem with a componentized content management system (CCMS) to curate personalized content for users. Hilger set the stage explaining the business value of a personalized digital experience and the logistics of these two technologies supporting one another to create it. Quinn makes these concepts more tangible by processing sample data into a knowledge graph in Python and querying the graph to find tailored information for a particular user. This post will again show the creation and querying of a knowledge graph in Python, however, the same sample data will now be sourced from external CSV files.
A Quick Note on CSVs
CSV files, or comma-separated values files, are widely used to store tabular data. If your company uses spreadsheet applications, such as Microsoft Excel or Google Sheets, or relational databases, then it is likely you have encountered CSV files before. This post will help you use the already existent, CSV-formatted data throughout your company, transform it into a usable knowledge graph, and resurface relevant pieces of information to users in a CCMS. Although this example uses CSV files as the tabular dataset format, the same principles apply to Excel sheets and SQL tables alike.
Aggregating Data
The diagram below is a visual model of the knowledge graph we will create from data in our example CSV files.
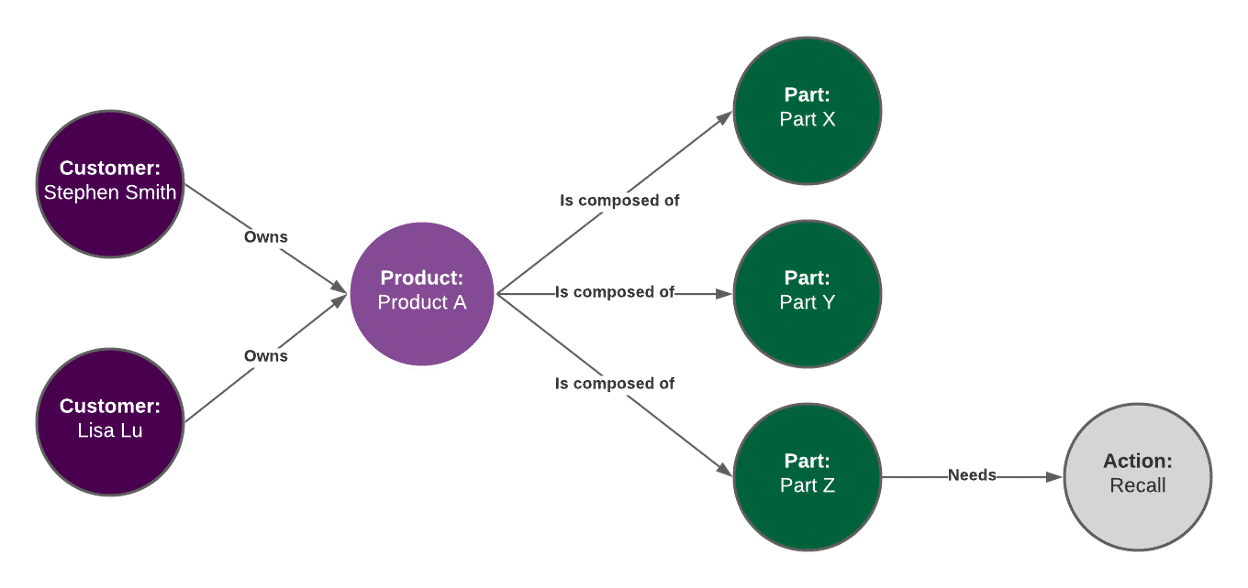
In order to populate this graph, just as in Quinn’s blog, we will begin with three sets of data about:
- Customers and the products they own
- Products and the parts they are composed of
- Parts and the actions that need to be taken on them
This information is stored in three CSV files, Customer_Data.csv, Product_Data.csv and Part_Data.csv:
Customers
| Customer ID | Customer Name | Owns Product |
| 1 | Stephen Smith | Product A |
| 2 | Lisa Lu | Product A |
Products
| Product ID | Product Name | Composed of |
| 1 | Product A | Part X |
| 1 | Product A | Part Y |
| 1 | Product A | Part Z |
Parts
| Part ID | Part Name | Action |
| 1 | Part X | |
| 2 | Part Y | |
| 3 | Part Z | Recall |
To create a knowledge graph from these tables, we will need to
- Read the data tables from our CSV files into DataFrames (an object representing a 2-D data structure, such as a spreadsheet or table)
- Transform the DataFrames into RDF triples and add them to the graph
In order to accomplish these two tasks, we will be utilizing two Python libraries. Pandas, a data analysis and manipulation library, will help us serialize our CSV files into DataFrames and rdflib, a library for working with RDF data, will allow us to create RDF triples from the data in our DataFrames.
Reading CSV Data
This first task is quite easy to accomplish using pandas. Pandas has a read_csv method for ingesting CSV data into a DataFrame. For this use case, we only need to provide two parameters: the CSV’s file path and the number of rows to read. To read the Customers table from our Customer_Data.csv file:
import pandas as pd

customer_table = pd.read_csv("Customer_Data.csv", nrows=2)
The value of customer_table is:
       Customer ID      Customer Name     Owns Product
0                1      Stephen Smith        Product A
1                2            Lisa Lu        Product A
We repeat this process for the Products and Parts files, altering the filepath_or_buffer and nrows parameters to reflect the respective file’s location and table size.
Tabular to RDF
Now that we have our tabular data stored in DataFrame variables, we are going to use rdflib to create subject-predicate-object triples for each column/row entry in the three DataFrames. I would recommend reading Quinn’s blog prior to this one as I am following the methods and conventions that he explains in his post.
Utilizing the Namespace module will provide us a shorthand for creating URIs, and the create_eg_uri method will url-encode our data values.
from rdflib import Namespace
from urllib.parse import quote

EG = Namespace("http://example.com/")

def create_eg_uri(name: str) -> URIRef:
    """Take a string and return a valid example.com URI"""
    quoted = quote(name.replace(" ", "_"))
    return EG[quoted]
The columns in our data tables will need to be mapped to predicates in our graph. For example, the Owns Product column in the Customers table will map to the http://example.com/owns predicate in our graph. We must define the column to predicate mappings for each of our tables before diving into the DataFrame transformations. Additionally, each mapping object contains a “uri” field which indicates the column to use when creating the unique identifier for an object.
customer_mapping = {
    "uri": "Customer Name",
    "Customer ID": create_eg_uri("customerId"),
    "Customer Name": create_eg_uri("customerName"),
    "Owns Product": create_eg_uri("owns"),
}

product_mapping = {

    "uri": "Product Name",
    "Product ID": create_eg_uri("productId"),
    "Product Name": create_eg_uri("productName"),
    "Composed of": create_eg_uri("isComposedOf"),
}

part_mapping = {

    "uri": "Part Name",
    "Part ID": create_eg_uri("partId"),
    "Part Name": create_eg_uri("partName"),
    "Action": create_eg_uri("needs"),
}

uri_objects = ["Owns Product", "Composed of", "Action"]
The uri_objects variable created above indicates which columns from the three data tables should have their values parsed as URI References, rather than Literals. For example, Composed of maps to a Part object. We want to make the <Part> object in the triple EG:Product_A EG:isComposedOf <Part> a URI pointing to/referencing a particular Part, not just the string name of the Part. Whereas the Product Name column creates triples such as EG:Product_A EG:productName “name” and “name” is simply a string, i.e. a Literal, and not a reference to another object.
Now, using all of the variables and methods declared above, we can begin the translation from DataFrame to RDF. For the purposes of this example, we create a global graph variable and a reusable translate_df_to_rdf function which we will call for each of the three DataFrames. With each call to the translate function, all triples for that particular table are added to the graph.
from rdflib import URIRef, Graph, Literal
import pandas as pd

graph = Graph()

def translate_df_to_rdf(customer_data, customer_mapping):
    # Counter variable representing current row in the table
    i = 0
    num_rows = len(customer_data.index)

    # For each row in the table
    while i < num_rows:
        # Create URI subject for triples in this row using ‘Name’ column
        name = customer_data.loc[i, customer_mapping["uri"]]
        row_uri = create_eg_uri(name)

        # For each column/predicate mapping in mapping dictionary
        for column_name, predicate in customer_mapping.items():

            # Grab the value at this specific row/column entry
            value = customer_data.loc[i, column_name]

            # Strip extra characters from value
            if isinstance(value, str):
                value = value.strip()

            # Check if the value exists
            if not pd.isnull((value)):
                # Determine if object should be a URI or Literal
                if column_name in uri_objects:
                    # Create URI object and add triple to graph
                    uri_value = create_eg_uri(value)
                    graph.add((row_uri, predicate, uri_value))
                else:
                    # Create Literal object and add triple to graph
                    graph.add((row_uri, predicate, Literal(value)))
        i = i + 1
Querying the Graph
In this case, we make three calls to translate_df_to_rdf:
translate_df_to_rdf(customer_data, customer_mapping)
translate_df_to_rdf(product_data, product_mapping)
translate_df_to_rdf(part_data, part_mapping)
Now that our graph is populated with the Customers, Products, and Parts data, we can query it for personalized content of our choosing. So, if we want to find all customers who own products that are composed of parts that need a recall, we can create and use the same query from Quinn’s previous blog:
sparql_query = """SELECT ?customer ?product
WHERE {
  ?customer eg:owns ?product .
  ?product eg:isComposedOf ?part .
  ?part eg:needs eg:Recall .
}"""

results = graph.query(sparql_query, initNs={"eg": EG})
for row in results:
    print(row)
As you would expect, the results printed in the console are two ?customer ?product pairings:
(rdflib.term.URIRef('http://example.com/Stephen_Smith'), rdflib.term.URIRef('http://example.com/Product_A'))
(rdflib.term.URIRef('http://example.com/Lisa_Lu'), rdflib.term.URIRef('http://example.com/Product_A'))
Summary
By transforming our CSV files into RDF triples, we created a centralized, connected graph of information, enabling the simple retrieval of very granular and case-specific data. In this case, we simply traversed the relationships in our graph between Customers, Products, Parts, and Actions to determine which Customers needed to be notified of a recall. In practice, these concepts can be expanded to meet any personalization needs for your organization.
Knowledge Graphs are an integral part of serving up targeted, useful information via a Componentized Content Management System, and your organization doesn’t need to start from scratch. CSVs and tabular data can easily be transformed into RDF and aggregated as the foundation for your organization’s Knowledge Graph. If you are interested in transforming your data into RDF and want help planning or implementing a transformation effort, contact us here.